Fig. 2.
Download original image
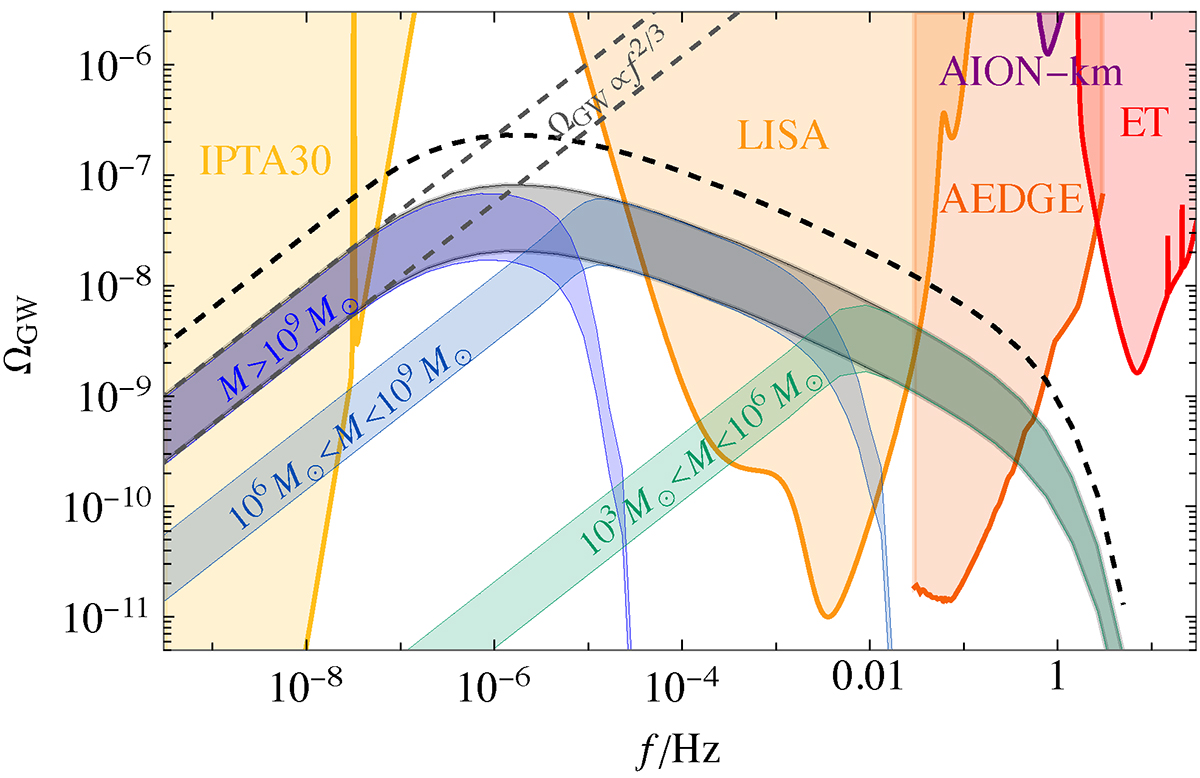
Mean GW energy density spectrum from massive BH mergers compared with the sensitivities of different experiments. The black dashed curve shows the case where all mergers of galaxies produce a GW signal for BHs heavier than 103 M⊙ (pBH = 1). The colored bands show the spectra from SMBHs heavier than 109 M⊙ (dark blue), from SMBHs in the range (106 M⊙, 109 M⊙); light blue), and from IMBHs with masses in the range 103 − 106 M⊙ (green), assuming a universal efficiency factor ![]() . The shaded regions show the prospective sensitivities of IPTA30 (Chen et al. 2017; Kaiser & McWilliams 2021), LISA (LISA Collaboration 2017), AEDGE (El-Neaj et al. 2020; Badurina et al. 2021), AION-km (Badurina et al. 2020, 2021) and ET (Sathyaprakash et al. 2012).
. The shaded regions show the prospective sensitivities of IPTA30 (Chen et al. 2017; Kaiser & McWilliams 2021), LISA (LISA Collaboration 2017), AEDGE (El-Neaj et al. 2020; Badurina et al. 2021), AION-km (Badurina et al. 2020, 2021) and ET (Sathyaprakash et al. 2012).
Current usage metrics show cumulative count of Article Views (full-text article views including HTML views, PDF and ePub downloads, according to the available data) and Abstracts Views on Vision4Press platform.
Data correspond to usage on the plateform after 2015. The current usage metrics is available 48-96 hours after online publication and is updated daily on week days.
Initial download of the metrics may take a while.