Fig. 9.
Download original image
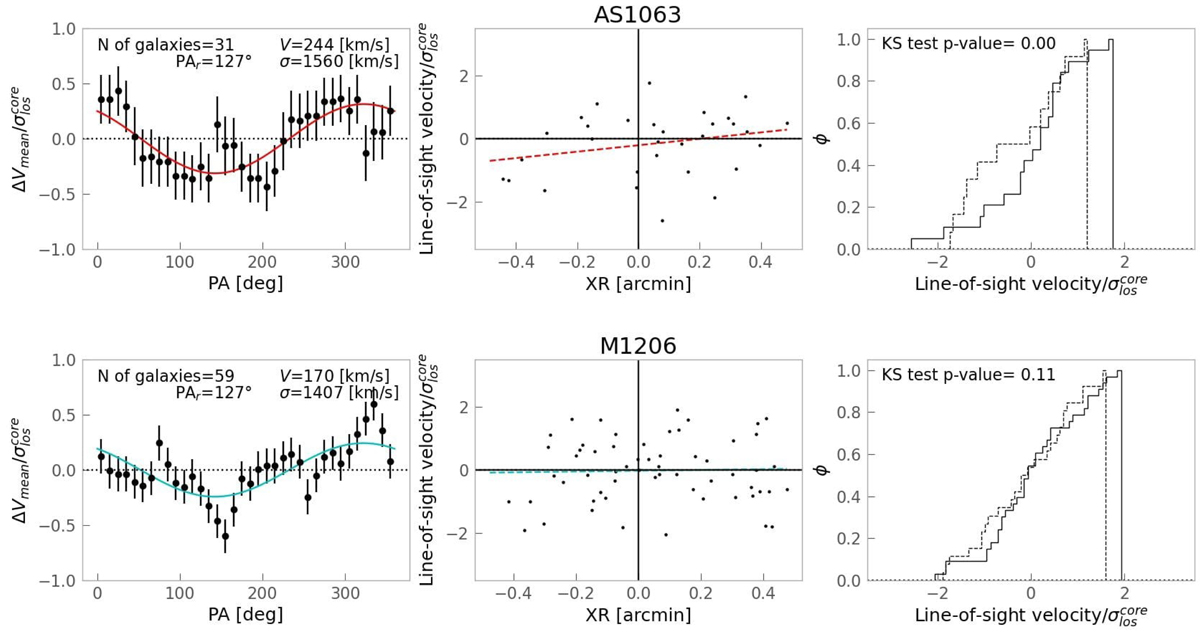
Diagnostic diagrams of the rotation signature detected in the core of the two clusters within 0.5′ from the center. This corresponds to the areas covered by the MUSE pointings. The left panels show the difference between the mean velocities ΔVmean on each side of a line passing through the center with the given angle (PA) divided by the velocity dispersion ![]() in the core of each sample. The continuous line is the sine function that best fits the observed patterns. In these panels, labels identify the number of galaxies within 0.5′, the value of the PA that maximizes |ΔVmean| (PAr), the rotation velocity V (half of the amplitude) from the best-fit sine function, and the value of
in the core of each sample. The continuous line is the sine function that best fits the observed patterns. In these panels, labels identify the number of galaxies within 0.5′, the value of the PA that maximizes |ΔVmean| (PAr), the rotation velocity V (half of the amplitude) from the best-fit sine function, and the value of ![]() . The central panels show the position–velocity diagrams constructed by considering the line-of-sight velocities as a function of the projected distances from the rotation axis (XR) in arcminutes. The dashed lines are the least square linear fits to the data. The right panels show the cumulative line-of-sight velocity distributions for the galaxies with XR < 0 (solid line) and for those with XR > 0 (dotted line). The labels provide the Kolmogorov-Smirnov p-value indicating the probability that the two samples are extracted from the same parent distribution. The p-value should be close to zero if the clusters are characterized by the presence of mean rotation.
. The central panels show the position–velocity diagrams constructed by considering the line-of-sight velocities as a function of the projected distances from the rotation axis (XR) in arcminutes. The dashed lines are the least square linear fits to the data. The right panels show the cumulative line-of-sight velocity distributions for the galaxies with XR < 0 (solid line) and for those with XR > 0 (dotted line). The labels provide the Kolmogorov-Smirnov p-value indicating the probability that the two samples are extracted from the same parent distribution. The p-value should be close to zero if the clusters are characterized by the presence of mean rotation.
Current usage metrics show cumulative count of Article Views (full-text article views including HTML views, PDF and ePub downloads, according to the available data) and Abstracts Views on Vision4Press platform.
Data correspond to usage on the plateform after 2015. The current usage metrics is available 48-96 hours after online publication and is updated daily on week days.
Initial download of the metrics may take a while.