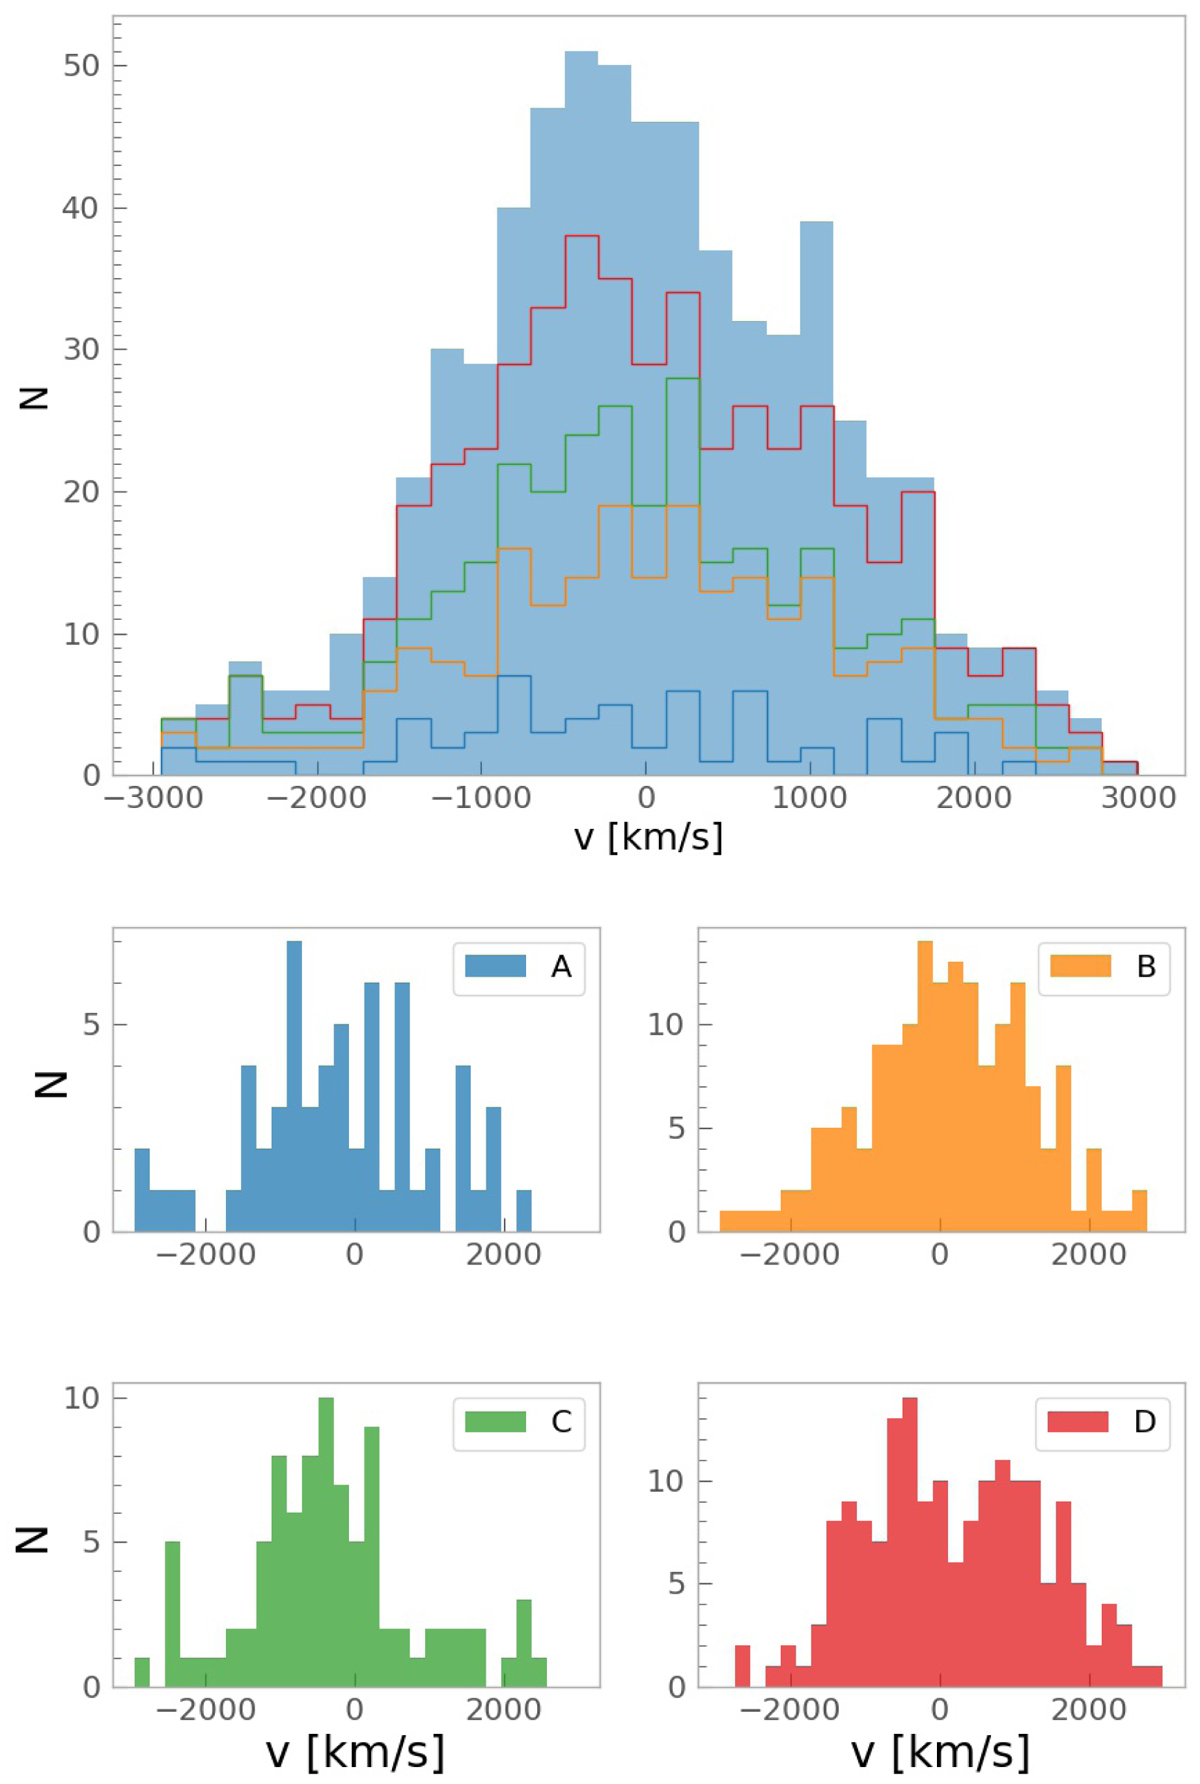
Fig. 7.
Download original image
Distribution of the line-of-sight velocities of member galaxies of M1206 contained in the sectors shown in Fig. 6. Upper histogram: stacked distribution of velocities in the four sectors compared to the total velocity distribution of Fig. 2. Lower histograms: velocity distributions of the galaxies in each sector. The sectors are identified as sector A in blue, sector B in orange, sector C in green, and sector D in red.
Current usage metrics show cumulative count of Article Views (full-text article views including HTML views, PDF and ePub downloads, according to the available data) and Abstracts Views on Vision4Press platform.
Data correspond to usage on the plateform after 2015. The current usage metrics is available 48-96 hours after online publication and is updated daily on week days.
Initial download of the metrics may take a while.