Fig. 16.
Download original image
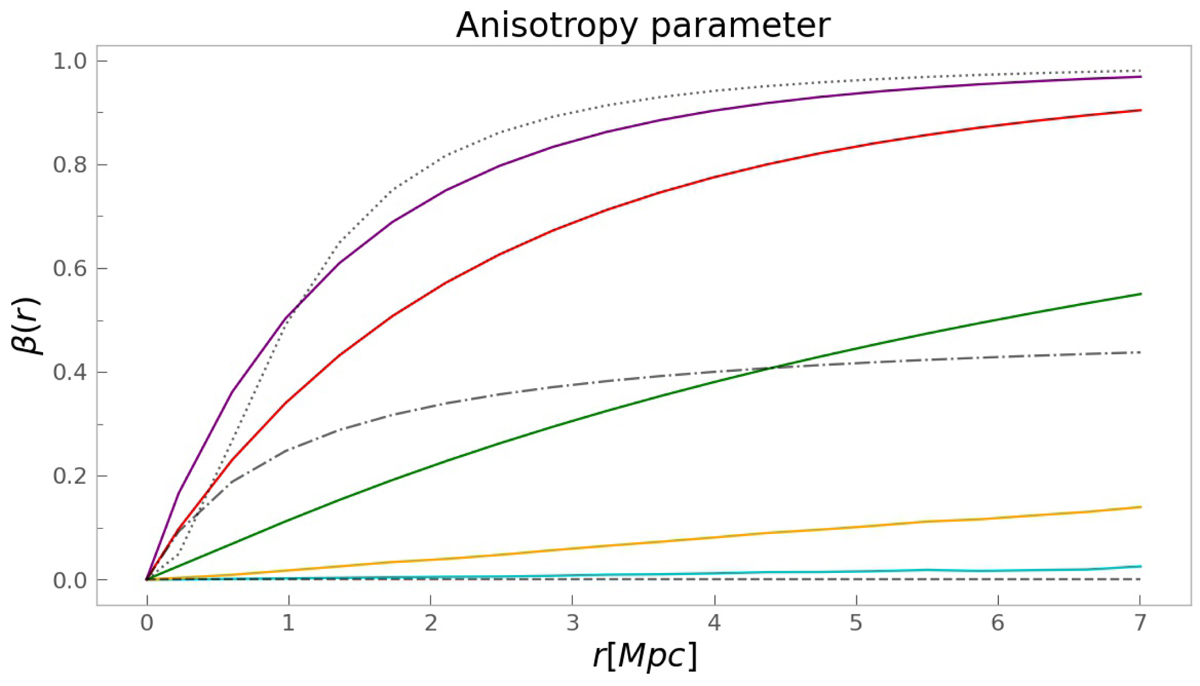
Anisotropy parameter radial profile. The colored solid lines show the anisotropy profile as a function of the free parameter d. The distribution of the stellar orbits associated with the adopted distribution function is characterized by isotropy in the central region and radially biased anisotropy in the outer parts, which becomes more prominent as the value of d increases. The dashed, dashed-dotted, and dotted gray curves represent, respectively, the isotropic, radial, and Osipkov–Merritt anisotropy profiles of Table 5.
Current usage metrics show cumulative count of Article Views (full-text article views including HTML views, PDF and ePub downloads, according to the available data) and Abstracts Views on Vision4Press platform.
Data correspond to usage on the plateform after 2015. The current usage metrics is available 48-96 hours after online publication and is updated daily on week days.
Initial download of the metrics may take a while.