Fig. 14.
Download original image
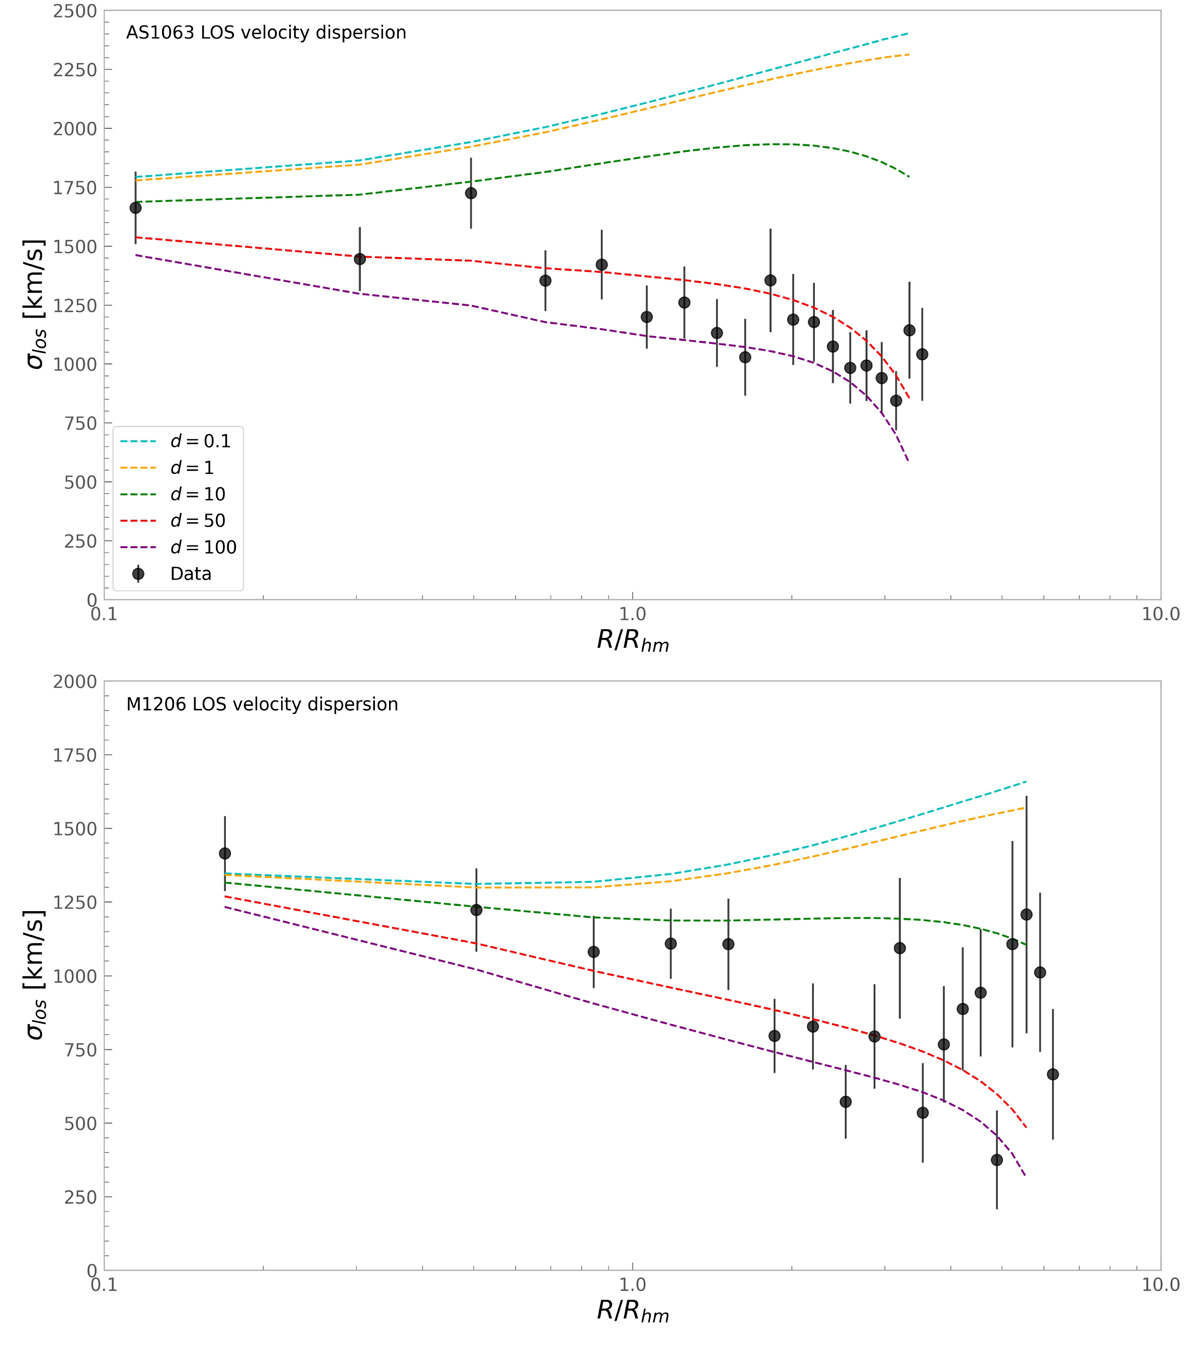
Line-of-sight velocity dispersion profile of the galactic component derived from the f(ν) distribution function with fitted parameters for AS1063 and M1206 (see Table 6). The plot shows the data points (in black) derived from spectroscopic data (see Fig. 5) superimposed on the velocity profiles derived from the moments of the distribution function for five choices of the value of the parameter d (see Fig. 16 for the associated anisotropy profile). Both clusters are well described by the velocity dispersion curves associated with a value of d ≈ 10 − 50.
Current usage metrics show cumulative count of Article Views (full-text article views including HTML views, PDF and ePub downloads, according to the available data) and Abstracts Views on Vision4Press platform.
Data correspond to usage on the plateform after 2015. The current usage metrics is available 48-96 hours after online publication and is updated daily on week days.
Initial download of the metrics may take a while.