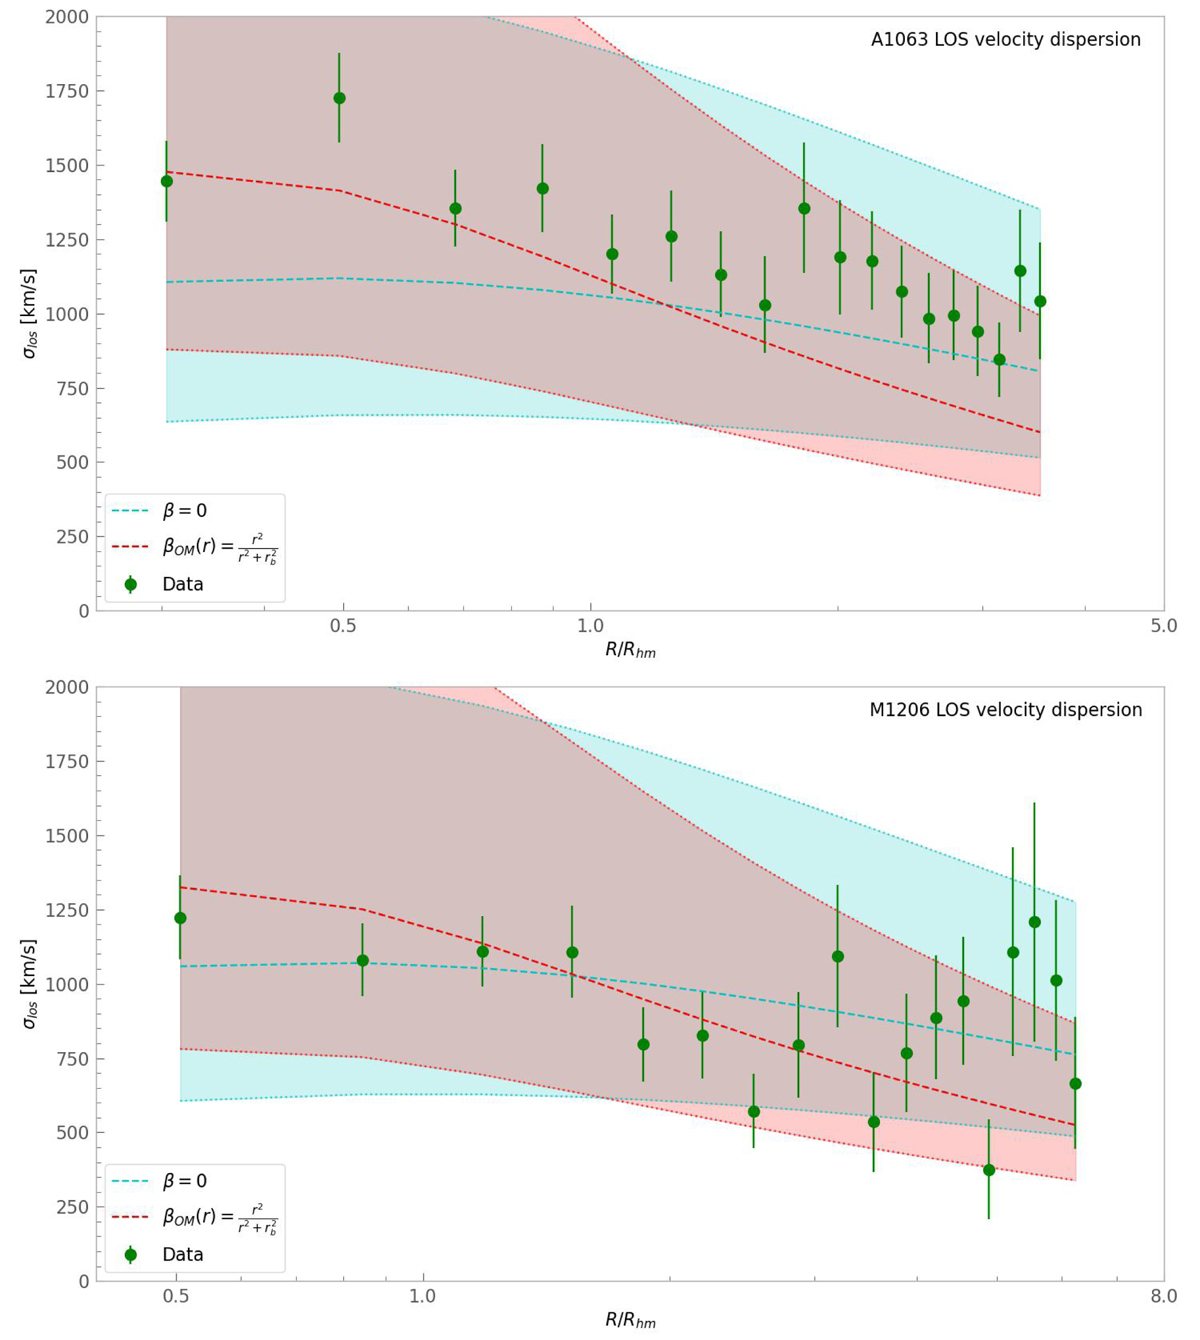
Fig. 13.
Download original image
Line-of-sight velocity dispersion profile of the galactic component obtained from the Jeans equation for AS1063 and M1206. The plots show the data points (in green) derived from the spectroscopic data (see Fig. 5) superimposed on the velocity profiles derived from the Jeans equation for two choices of β(r): the constant isotropic β = 0 profile (in cyan) and the Osipkov–Merritt anisotropy profile (in red). The confidence regions were found by allowing the total mass M(r) to vary within the uncertainties of the values of its parameters reported in Table 4. The confidence levels were underestimated for R > 3 Mpc because, in this region, the total mass M(r) is extrapolated and not directly constrained by the observations.
Current usage metrics show cumulative count of Article Views (full-text article views including HTML views, PDF and ePub downloads, according to the available data) and Abstracts Views on Vision4Press platform.
Data correspond to usage on the plateform after 2015. The current usage metrics is available 48-96 hours after online publication and is updated daily on week days.
Initial download of the metrics may take a while.