Open Access
Fig. 12.
Download original image
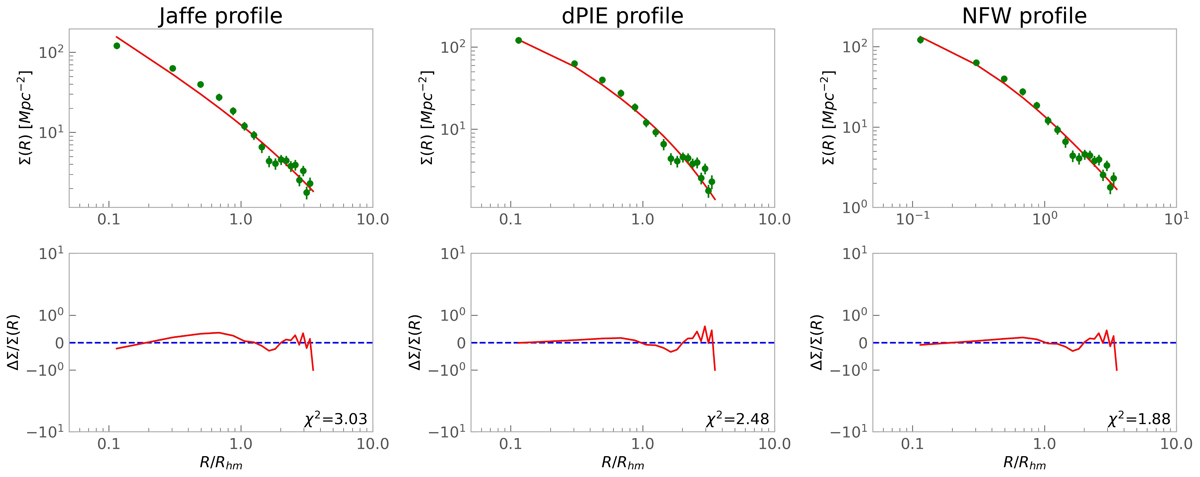
Observed surface number density of AS1063 (in green) fitted with the projected Jaffe, dPIE, and NFW profiles (in red). Top row: profiles resulting from the best-fit process. Bottom row: fractional deviations between the analytical model and the photometric data. The labels provide the reduced χ2 values.
Current usage metrics show cumulative count of Article Views (full-text article views including HTML views, PDF and ePub downloads, according to the available data) and Abstracts Views on Vision4Press platform.
Data correspond to usage on the plateform after 2015. The current usage metrics is available 48-96 hours after online publication and is updated daily on week days.
Initial download of the metrics may take a while.