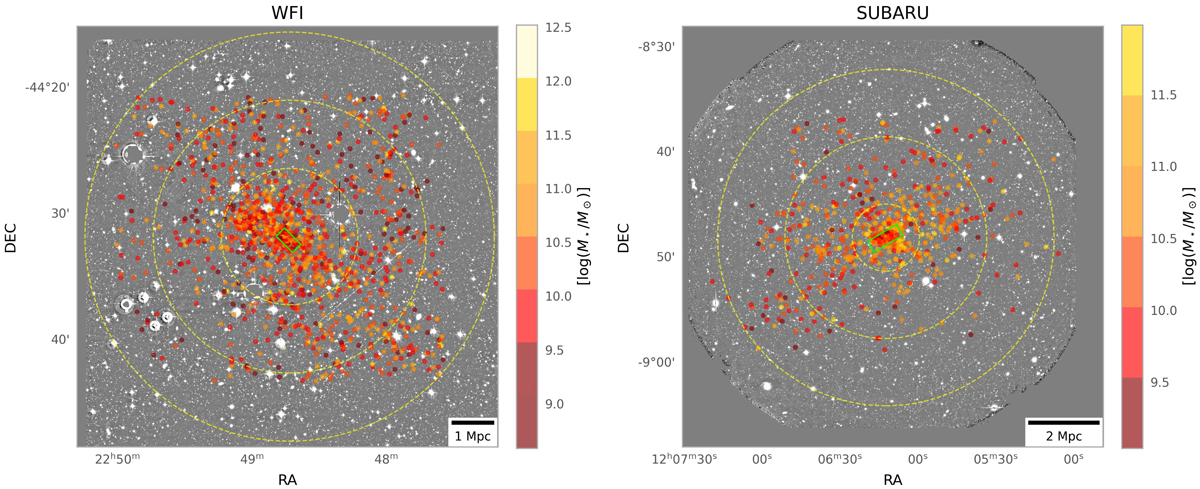
Fig. 1.
Download original image
View of the cluster members of Abell S1063 (left) and MACS J1206.2−0847 (right). The gray scale background image on the left (right) is the WFI (SUBARU) observation in the Rc band spanning an area of ≈25 × 25 arcmin2. The member galaxies are plotted as colored dots. The colors correspond to the stellar mass values of each galaxy as reported in the color bar. The three concentric yellow circles represent the distances of 1.5, 3, and 4.5 Mpc (1, 3, and 5 Mpc) from the cluster center identified with the BCG. The green rectangle represents the ≈1 × 2 arcmin2 (≈1 × 2.63 arcmin2) area covered by the MUSE spectroscopic follow-up on the inner regions of the cluster.
Current usage metrics show cumulative count of Article Views (full-text article views including HTML views, PDF and ePub downloads, according to the available data) and Abstracts Views on Vision4Press platform.
Data correspond to usage on the plateform after 2015. The current usage metrics is available 48-96 hours after online publication and is updated daily on week days.
Initial download of the metrics may take a while.