Open Access
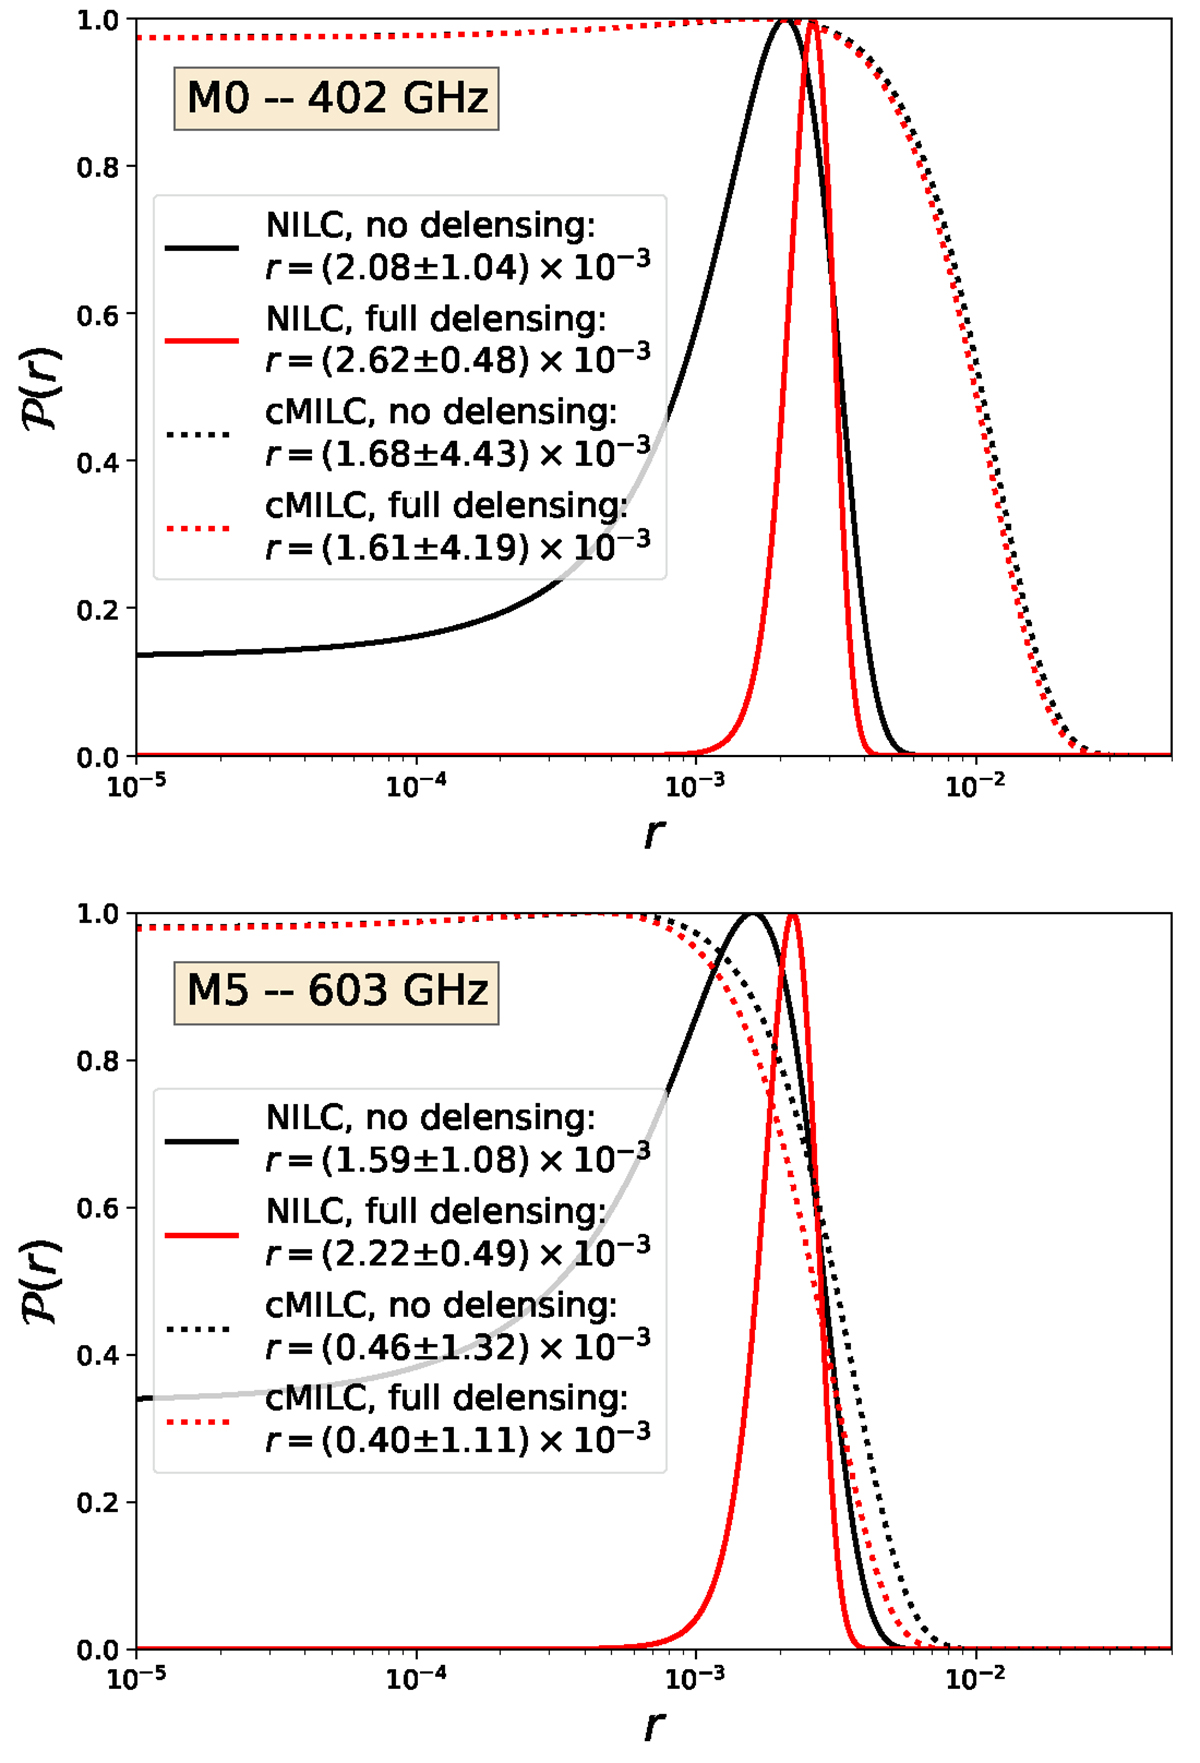
Fig. 6.
Download original image
Comparison of recovered tensor-to-scalar ratio distributions from NILC (solid lines) and cMILC (dotted lines) for the M0 (top panel) and M5 (bottom panel) instrument configurations. Results without delensing are shown as black curves, while results with full delensing are shown as red lines.
Current usage metrics show cumulative count of Article Views (full-text article views including HTML views, PDF and ePub downloads, according to the available data) and Abstracts Views on Vision4Press platform.
Data correspond to usage on the plateform after 2015. The current usage metrics is available 48-96 hours after online publication and is updated daily on week days.
Initial download of the metrics may take a while.