Fig. 5.
Download original image
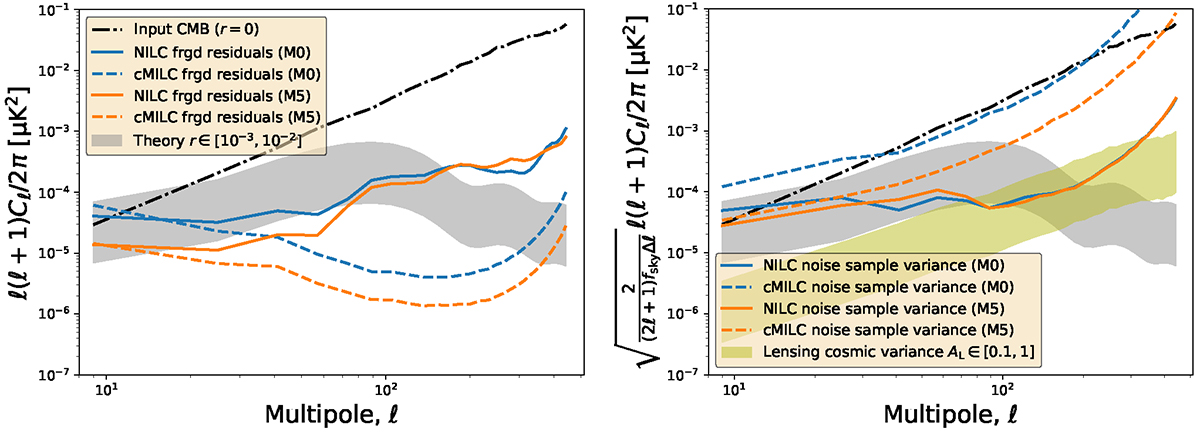
Power spectrum of residual foreground contamination (left panel) and noise (right panel) with NILC (solid lines) and cMILC (dashed lines) on fsky = 50% of the sky for the M0 (blue) and M5 (orange) configurations. For reference, we show the input CMB B-mode signal (r = 0, black dash-dotted line), the primordial B-mode signal expected from theory for values ranging from r = 10−2 down to r = 10−3 (gray-shaded area), and the residual lensing cosmic variance (yellow-shaded area) for no delensing (AL = 1) up to 90% delensing (AL = 0.1). All the spectra are binned with a multipole bin size of Δℓ = 16.
Current usage metrics show cumulative count of Article Views (full-text article views including HTML views, PDF and ePub downloads, according to the available data) and Abstracts Views on Vision4Press platform.
Data correspond to usage on the plateform after 2015. The current usage metrics is available 48-96 hours after online publication and is updated daily on week days.
Initial download of the metrics may take a while.