Fig. 4.
Download original image
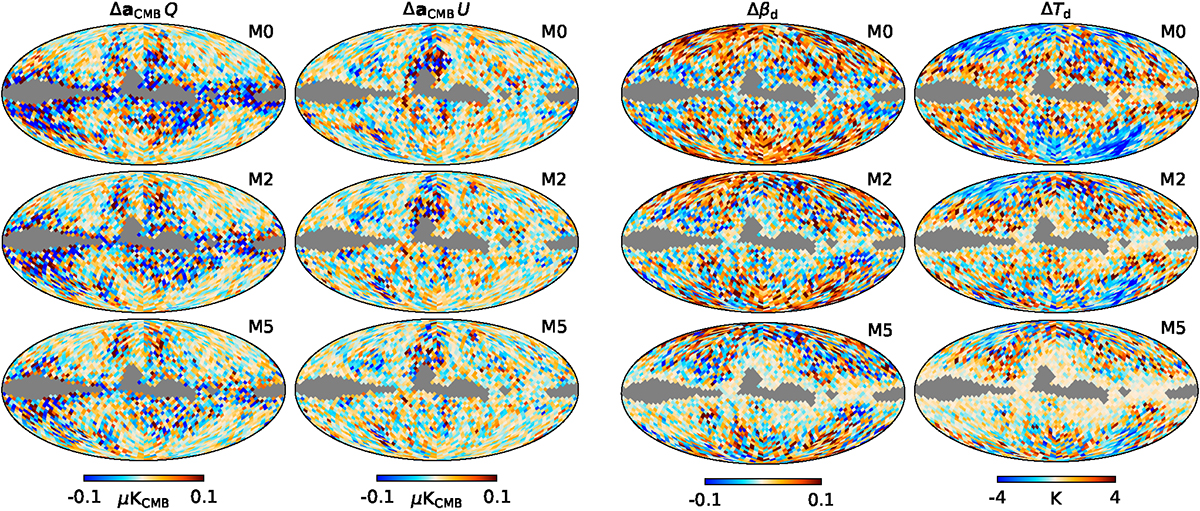
Commander residual (output minus input) maps for selected parameters and instrument configurations for one arbitrarily selected Monte Carlo sample. Columns show, from left to right: (1) CMB Stokes Q; (2) CMB Stokes U; (3) thermal dust spectral index; and (4) thermal dust temperature. Rows show M0, M2, and M5. The maps show one typical realization. Gray pixels indicate the masked pixels with fsky = 90%.
Current usage metrics show cumulative count of Article Views (full-text article views including HTML views, PDF and ePub downloads, according to the available data) and Abstracts Views on Vision4Press platform.
Data correspond to usage on the plateform after 2015. The current usage metrics is available 48-96 hours after online publication and is updated daily on week days.
Initial download of the metrics may take a while.