Fig. 2.
Download original image
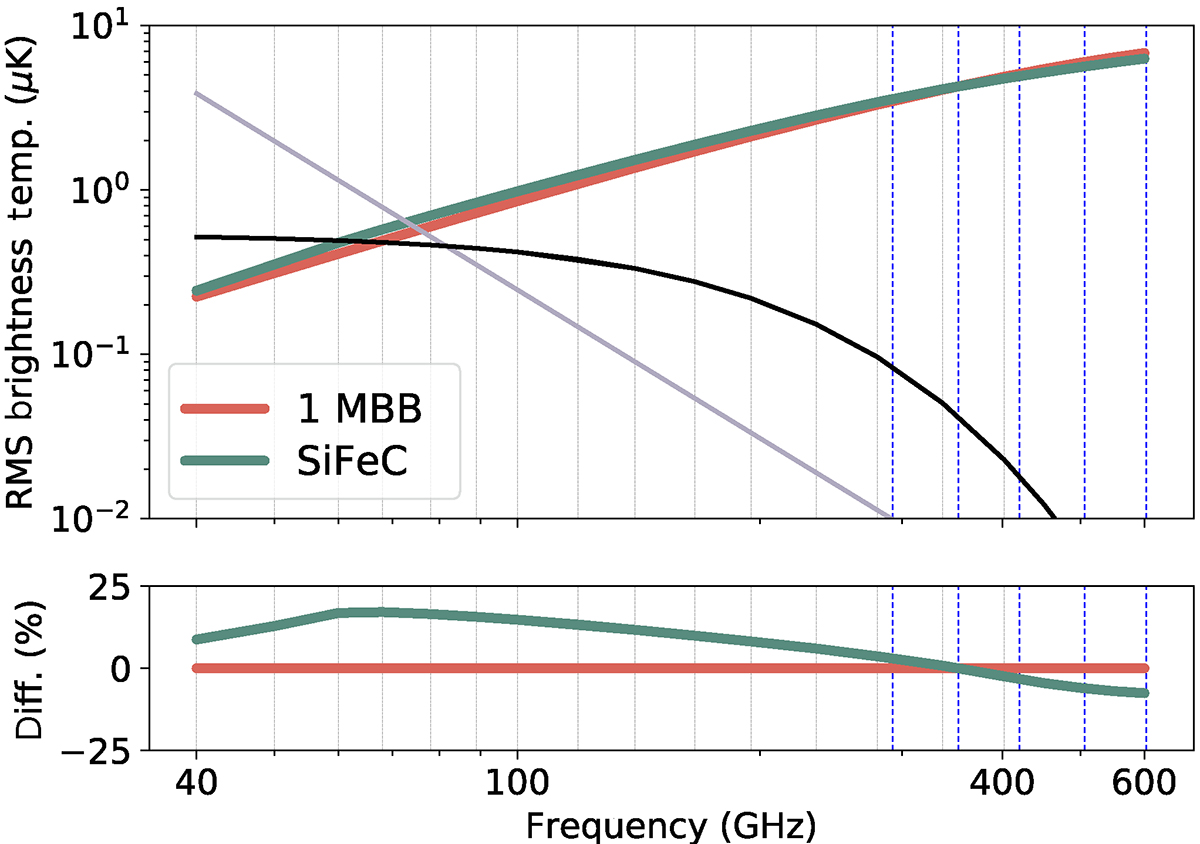
SEDs of the two dust models considered in this work, the 1 MBB, (red line) and the physical dust model SiFeC, (green line). The black line shows the SED of the CMB, while the gray refers to synchrotron emission. All the SEDs are in brightness temperature units and are computed considering the rms of Stokes Q and U maps on 70% of the sky. Sky masks are obtained by retaining the cleanest fraction of the sky in polarized intensity at 100 GHz. Vertical gray lines show the central frequency of the baseline LiteBIRD frequency channels, and in blue dashed lines we report the central frequency of the HFT M5 extension. The bottom panel shows the percentage difference of SiFeC with respect to MBB.
Current usage metrics show cumulative count of Article Views (full-text article views including HTML views, PDF and ePub downloads, according to the available data) and Abstracts Views on Vision4Press platform.
Data correspond to usage on the plateform after 2015. The current usage metrics is available 48-96 hours after online publication and is updated daily on week days.
Initial download of the metrics may take a while.