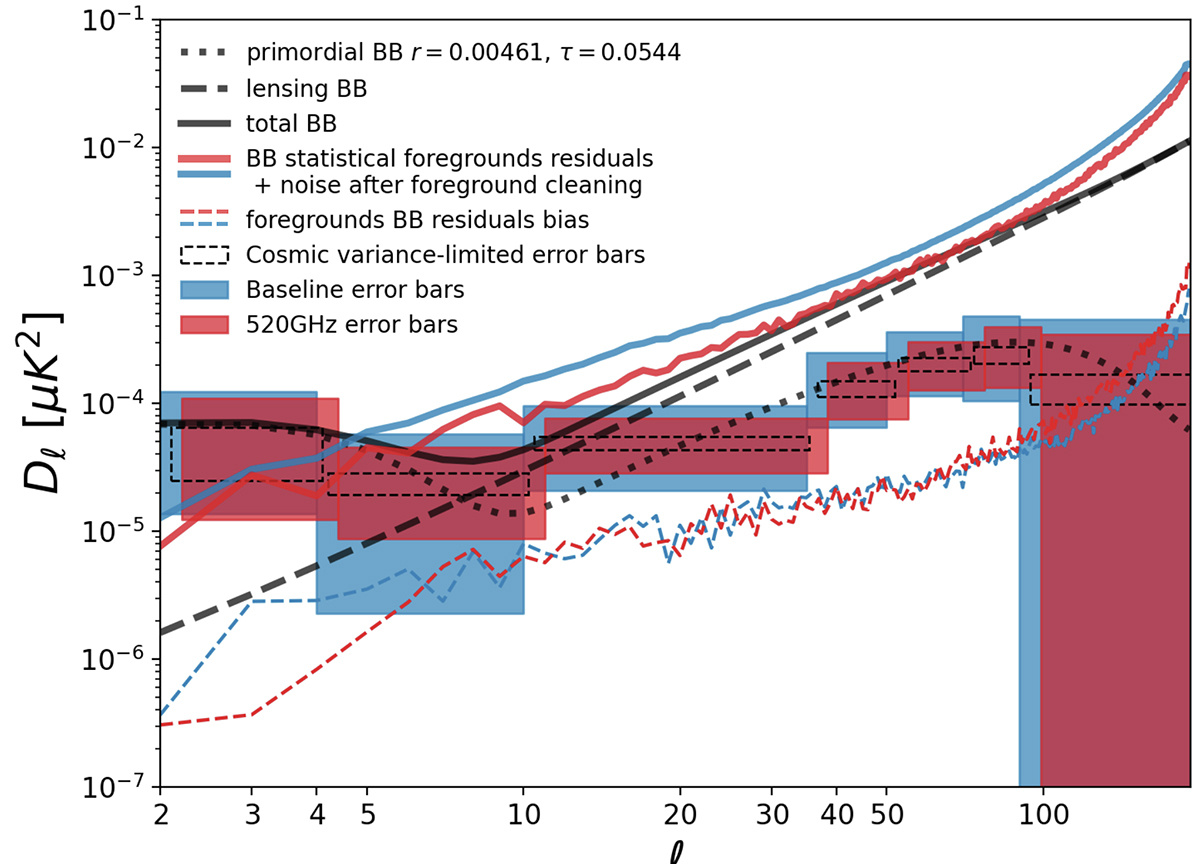
Fig. A.1.
Download original image
Example of the results from the FGBuster component-separation runs. Two instrumental configurations are considered: the baseline M0 (blue) and the high frequency extension M3 (red). The solid lines represent the post-component-separation noise and foreground residuals Sℓ, computed by averaging 1000 simulations for the baseline, and averaging 10 simulations for the extension. Together with the power from gravitational lensing and primordial B-modes, they define the error bars on the CMB power spectrum (boxes).
Current usage metrics show cumulative count of Article Views (full-text article views including HTML views, PDF and ePub downloads, according to the available data) and Abstracts Views on Vision4Press platform.
Data correspond to usage on the plateform after 2015. The current usage metrics is available 48-96 hours after online publication and is updated daily on week days.
Initial download of the metrics may take a while.