Fig. 12.
Download original image
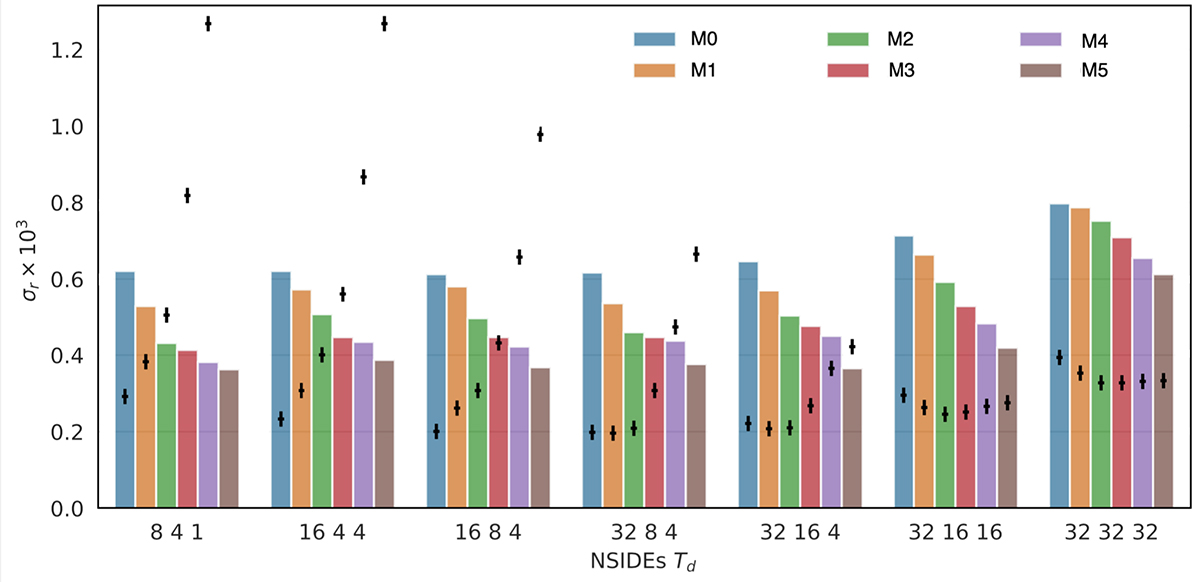
Fisher uncertainty (bars) and bias (black crosses) on r for different instrumental (colors) and FGBuster component-separation configuration (bar groups). The values on the horizontal axis define the Nside resolution at which the temperature of the thermal dust component is fitted for in the best 20%, 20–40% and 40–60% sky fractions.
Current usage metrics show cumulative count of Article Views (full-text article views including HTML views, PDF and ePub downloads, according to the available data) and Abstracts Views on Vision4Press platform.
Data correspond to usage on the plateform after 2015. The current usage metrics is available 48-96 hours after online publication and is updated daily on week days.
Initial download of the metrics may take a while.