Fig. 8.
Download original image
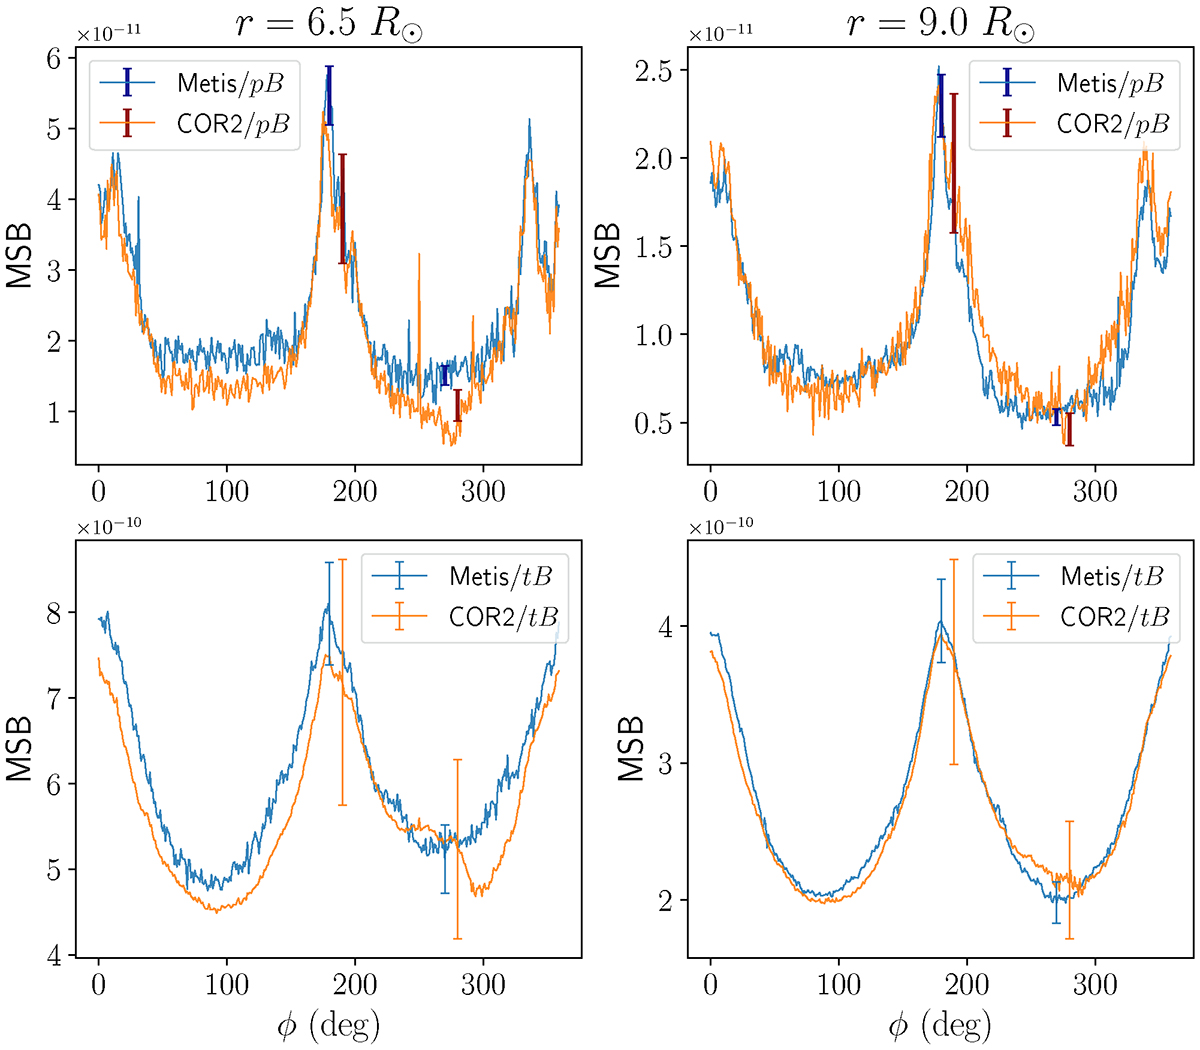
Latitudinal profiles of the pB (top panels) and tB images (bottom panels) of Metis and COR2 shown in Fig. 7 at the heliocentric distance of 6.5 R⊙ (left panels) and 9 R⊙ (right panels). The blue and orange lines show profiles of Metis and COR2, respectively. The error bars represent the uncertainties of the considered data (see the main text for details).
Current usage metrics show cumulative count of Article Views (full-text article views including HTML views, PDF and ePub downloads, according to the available data) and Abstracts Views on Vision4Press platform.
Data correspond to usage on the plateform after 2015. The current usage metrics is available 48-96 hours after online publication and is updated daily on week days.
Initial download of the metrics may take a while.