Open Access
Fig. 5
Download original image
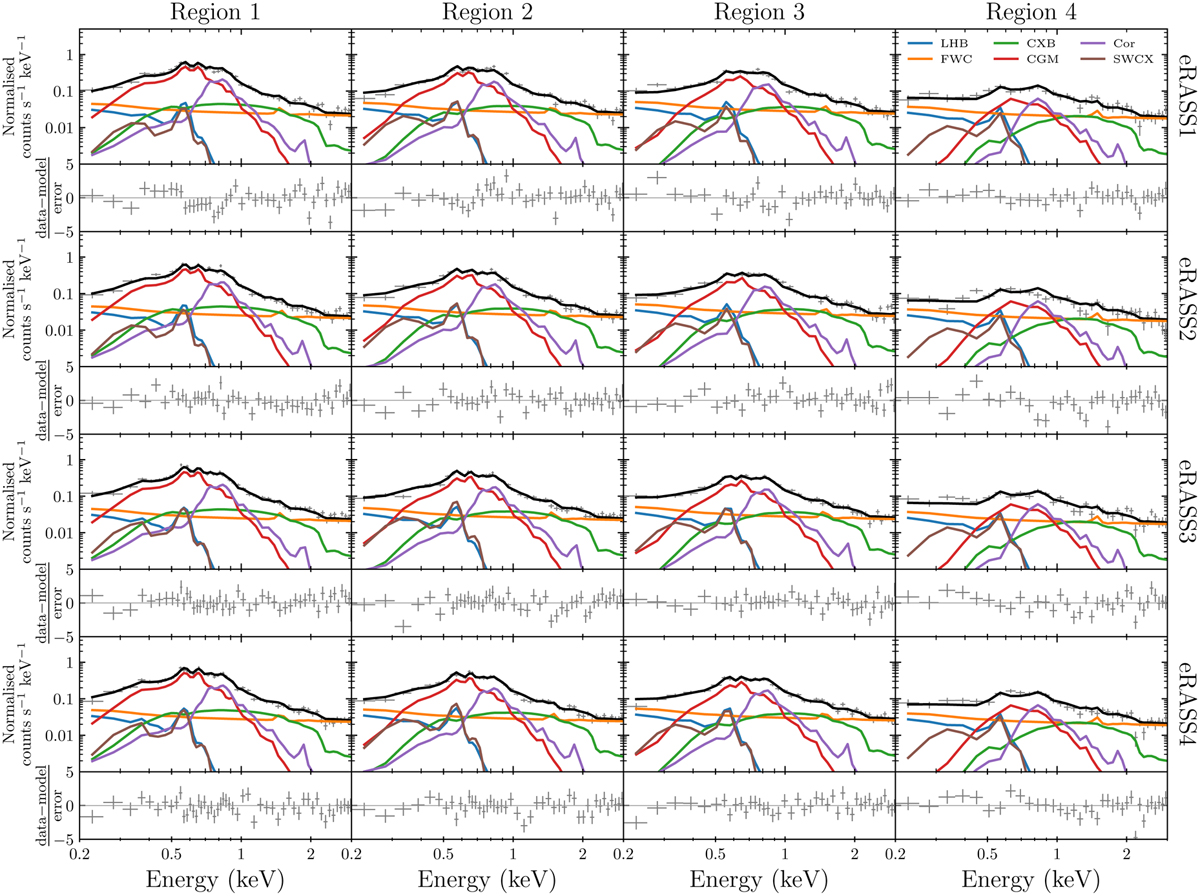
Spectral model of Cha II & III as functions of time in half-year intervals (from top to bottom row) and column density (from left to right column). Each panel shows the TM-averaged data in grey and the corresponding model in black. The constituents of the models are also shown (see the legend).
Current usage metrics show cumulative count of Article Views (full-text article views including HTML views, PDF and ePub downloads, according to the available data) and Abstracts Views on Vision4Press platform.
Data correspond to usage on the plateform after 2015. The current usage metrics is available 48-96 hours after online publication and is updated daily on week days.
Initial download of the metrics may take a while.