Fig. A.4
Download original image
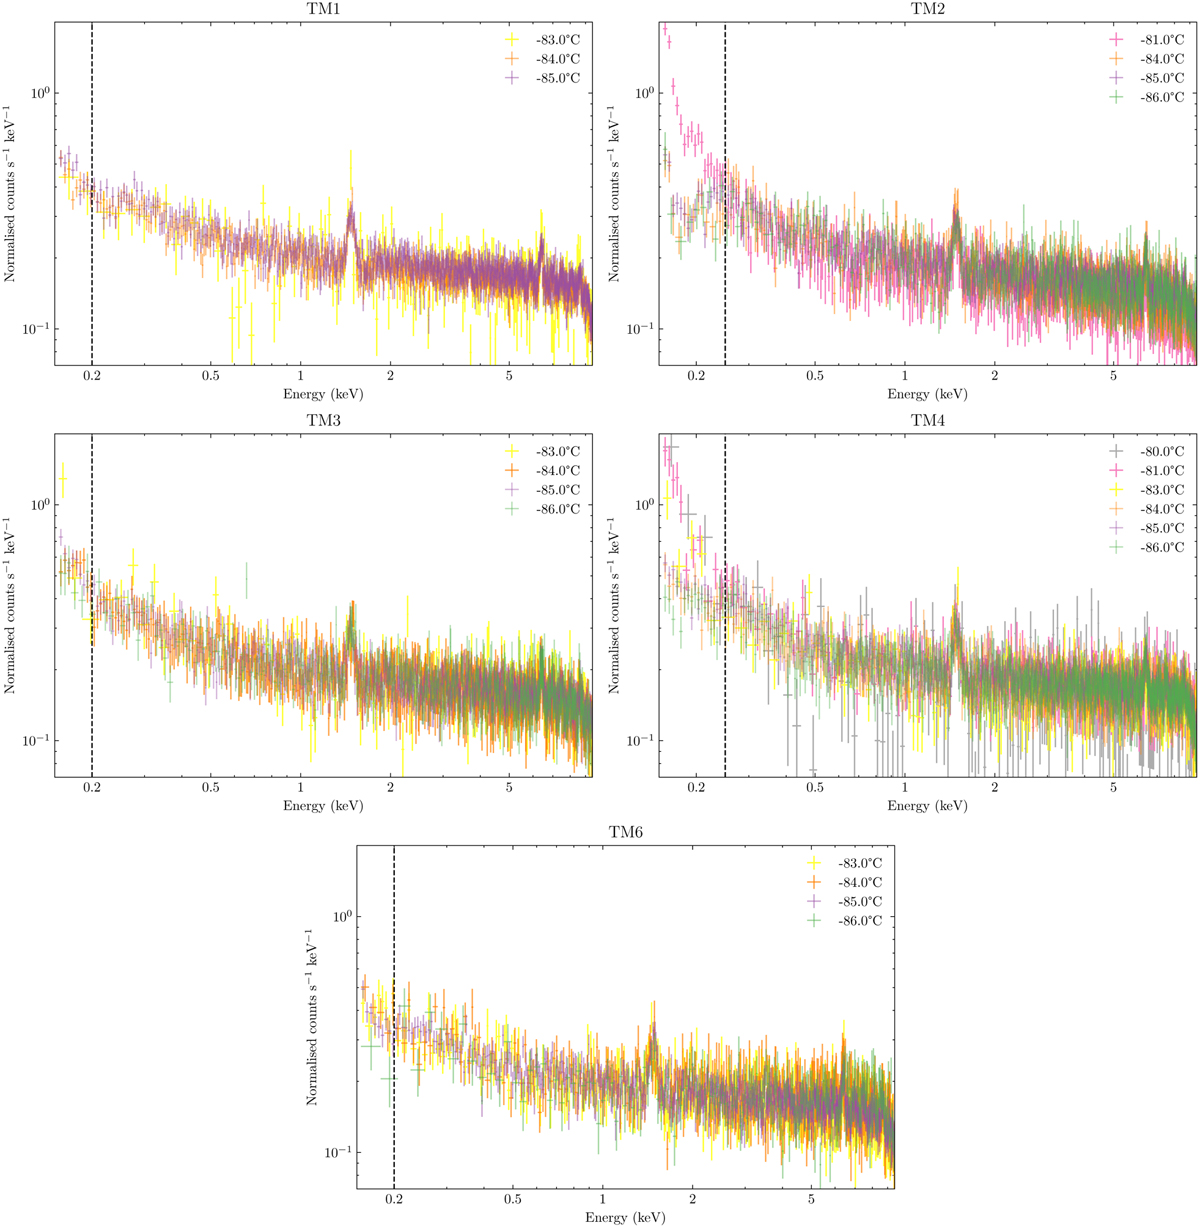
FWC Spectra of as a function of CCD temperature. Each temperature bin has a width of 1 °C centering at the temperature indicated in the legend. The size of the error bars reflect the duration the detector was in the corresponding temperature when the FWC observations were taken. The vertical dashed lines indicate the energy below which variability sets in.
Current usage metrics show cumulative count of Article Views (full-text article views including HTML views, PDF and ePub downloads, according to the available data) and Abstracts Views on Vision4Press platform.
Data correspond to usage on the plateform after 2015. The current usage metrics is available 48-96 hours after online publication and is updated daily on week days.
Initial download of the metrics may take a while.