Open Access
Fig. A.2
Download original image
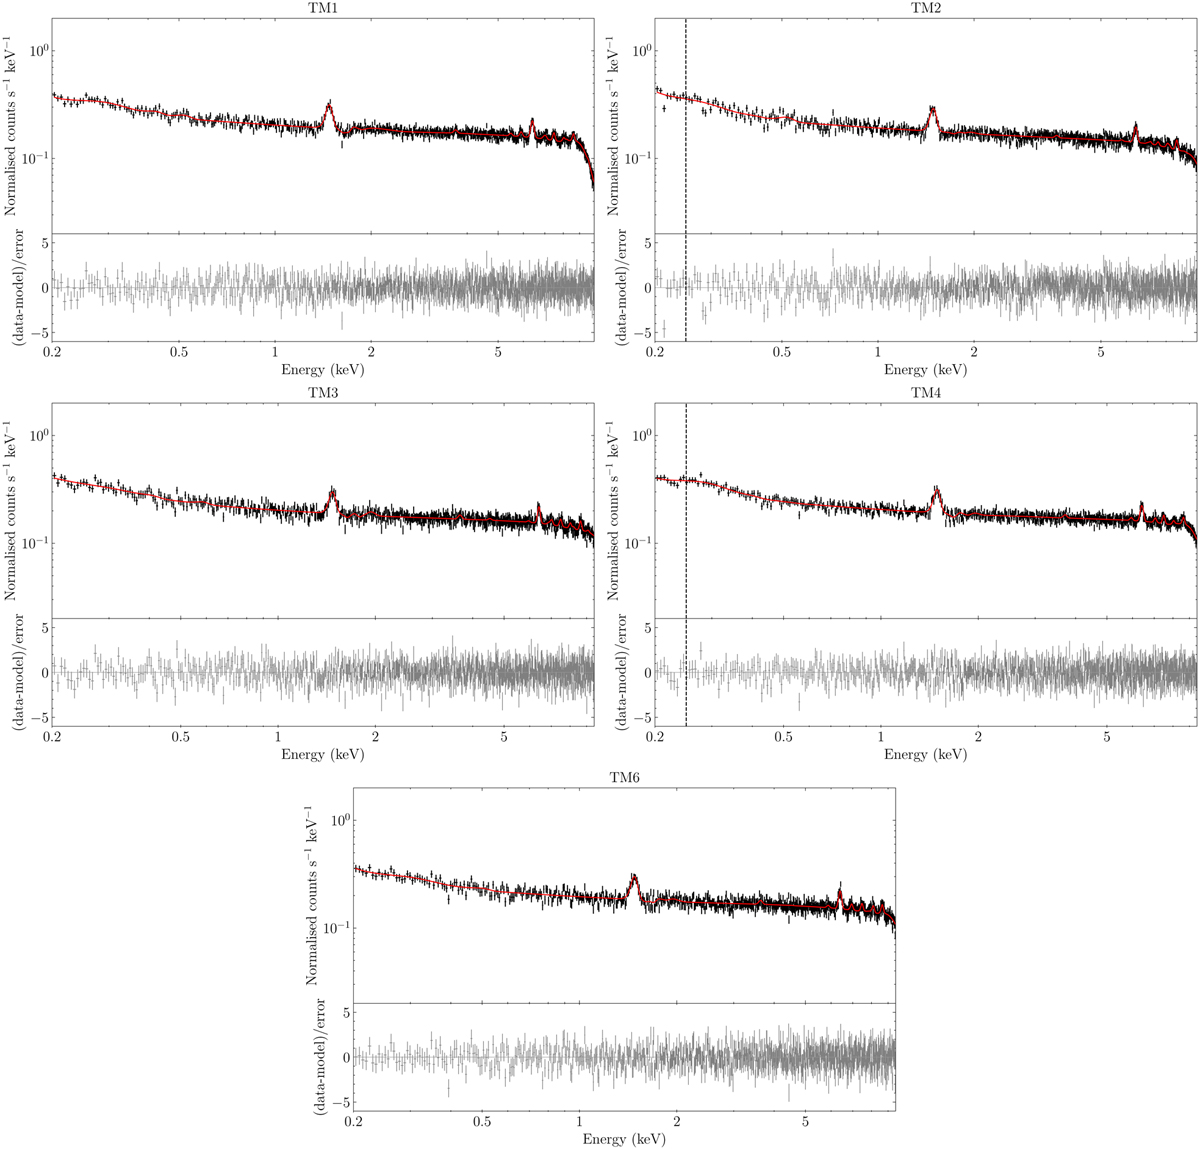
FWC spectra of all patterns for TM1–4 and 6. The best-fit FWC model is shown in red. The vertical dashed lines show the lowest energy the FWC model is employed due to variability considerations (Section A.1).
Current usage metrics show cumulative count of Article Views (full-text article views including HTML views, PDF and ePub downloads, according to the available data) and Abstracts Views on Vision4Press platform.
Data correspond to usage on the plateform after 2015. The current usage metrics is available 48-96 hours after online publication and is updated daily on week days.
Initial download of the metrics may take a while.