Fig. A.1
Download original image
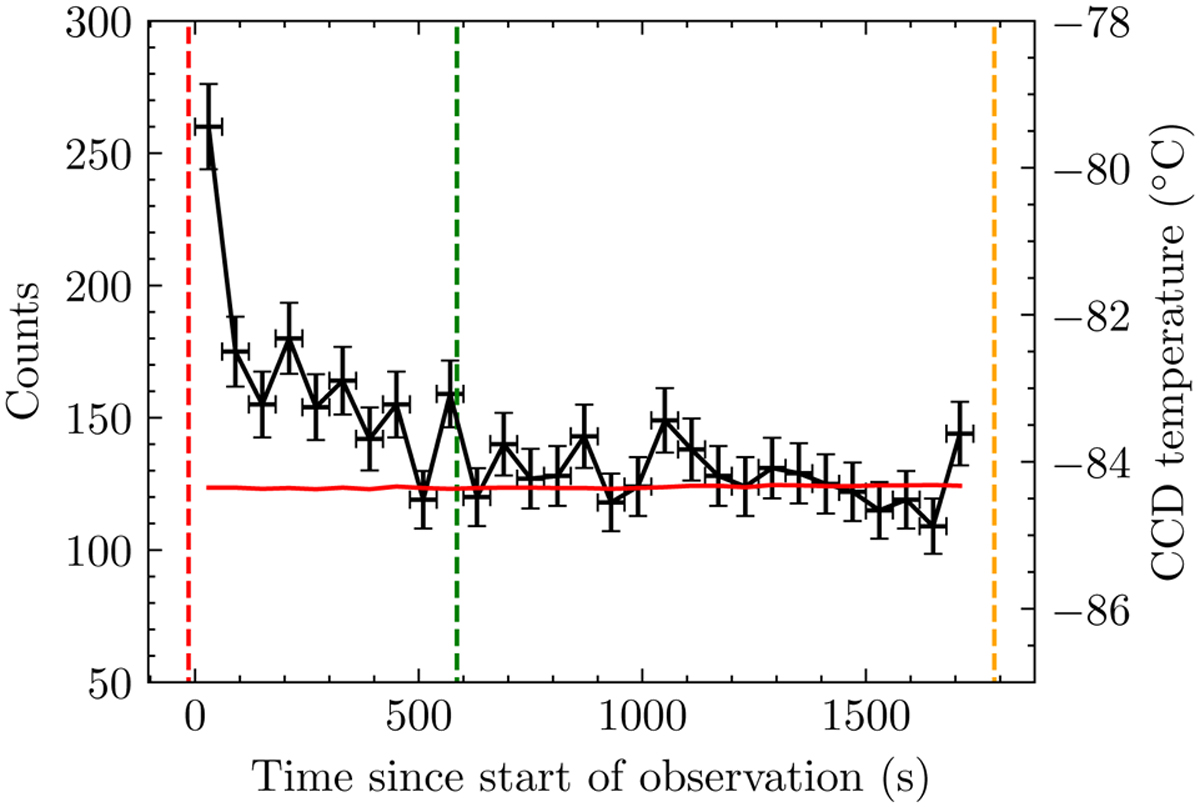
Example FWC light curve in eRASS1 at the 0.5 < E < 10 keV band. The vertical red dashed line indicates when the filter wheel stopped rotating and stopped at the CLOSED position. The green dashed line indicates the reference cut-off time, which is 10 min after the red line. The orange line represents the time stamp when the filter wheel rotates again after the observation. Any events recorded between the red and green dashed lines are removed from the FWC dataset, and only events sandwiched between the green and orange dashed lines were considered. The width of the time bin is 60 s. The red horizontal line plots the CCD temperature in °C.
Current usage metrics show cumulative count of Article Views (full-text article views including HTML views, PDF and ePub downloads, according to the available data) and Abstracts Views on Vision4Press platform.
Data correspond to usage on the plateform after 2015. The current usage metrics is available 48-96 hours after online publication and is updated daily on week days.
Initial download of the metrics may take a while.