Fig. 1
Download original image
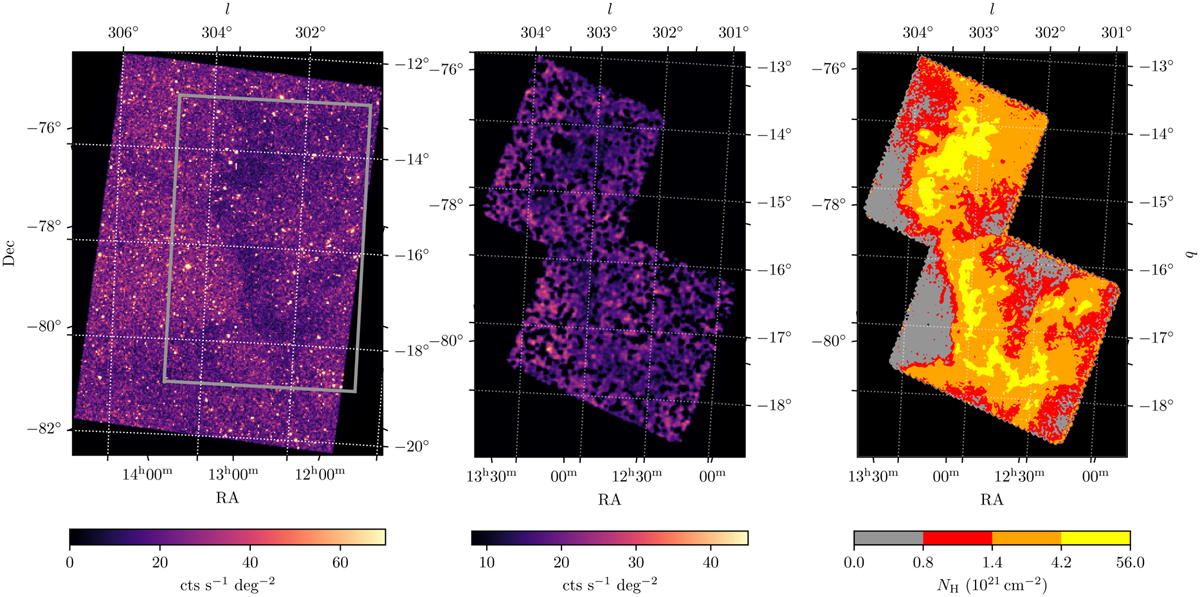
eROSITA 0.2−3 keV image of the shadow cast by Cha II & III. The left panel shows the eROSITA 0.2−3 keV band image of Cha II & III colour-coded with the vignetting-corrected count rate. The grey rectangular box indicates the region shown in the middle and right plots. The middle panel shows the point-source-fřee region where spectral analysis is carried out. The two rectangular mosaics represent the region covered by the Herschel column density map. The right panel shows the four column density bins that define the regions for spectral extraction. The dotted grid is in the Galactic coordinate system.
Current usage metrics show cumulative count of Article Views (full-text article views including HTML views, PDF and ePub downloads, according to the available data) and Abstracts Views on Vision4Press platform.
Data correspond to usage on the plateform after 2015. The current usage metrics is available 48-96 hours after online publication and is updated daily on week days.
Initial download of the metrics may take a while.