Fig. 8.
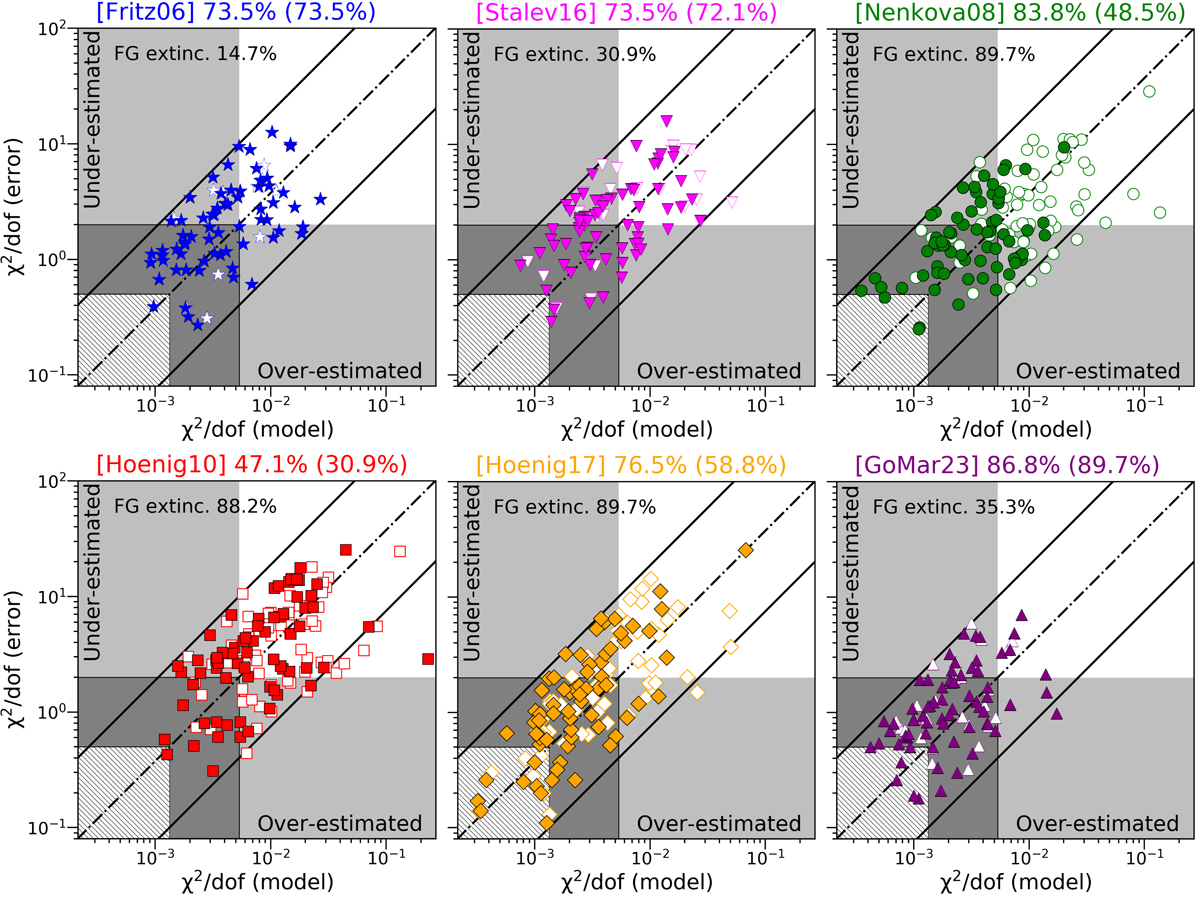
Download original image
Reduced χ2 using the errors in the χ2 definition (χ2(error)/d.o.f., see Eq. (A.1)), versus that using the model in the χ2 definition (χ2(model)/d.o.f., see Eq. (A.2)). Filled and empty symbols show the values when foreground extinction is included and neglected in the spectral fitting procedure, respectively. The dot-dashed line shows the locus expected if both measurements agree with each other. The continuous lines show a factor of five of agreement between both χ2 definitions. An object located in the blank area shows complexity not well fitted by the model. The dashed area shows the locus when the model is too complex for the data (χ2/d.o.f. < 0.5). The dark-gray shaded area shows the locus where both reduced χ2 indicate that the model provides a statistically acceptable fit (i.e., χ2/d.o.f.(error) < 2 and χ2/d.o.f.(model) < 1.5 × 10⁻³). The light-gray shaded area shows the region where the object is expected to locate if the error bars of the spectra are overestimated and underestimated although the spectral fit is good. Each panel shows the results for one of the models. We show the percentage of good spectral fits per model, considering those objects in the gray areas (the result without foreground extinction is shown next to it). The percentage of objects statistically requesting foreground extinction (FG extinct.) is shown in the top-left corner of each figure.
Current usage metrics show cumulative count of Article Views (full-text article views including HTML views, PDF and ePub downloads, according to the available data) and Abstracts Views on Vision4Press platform.
Data correspond to usage on the plateform after 2015. The current usage metrics is available 48-96 hours after online publication and is updated daily on week days.
Initial download of the metrics may take a while.