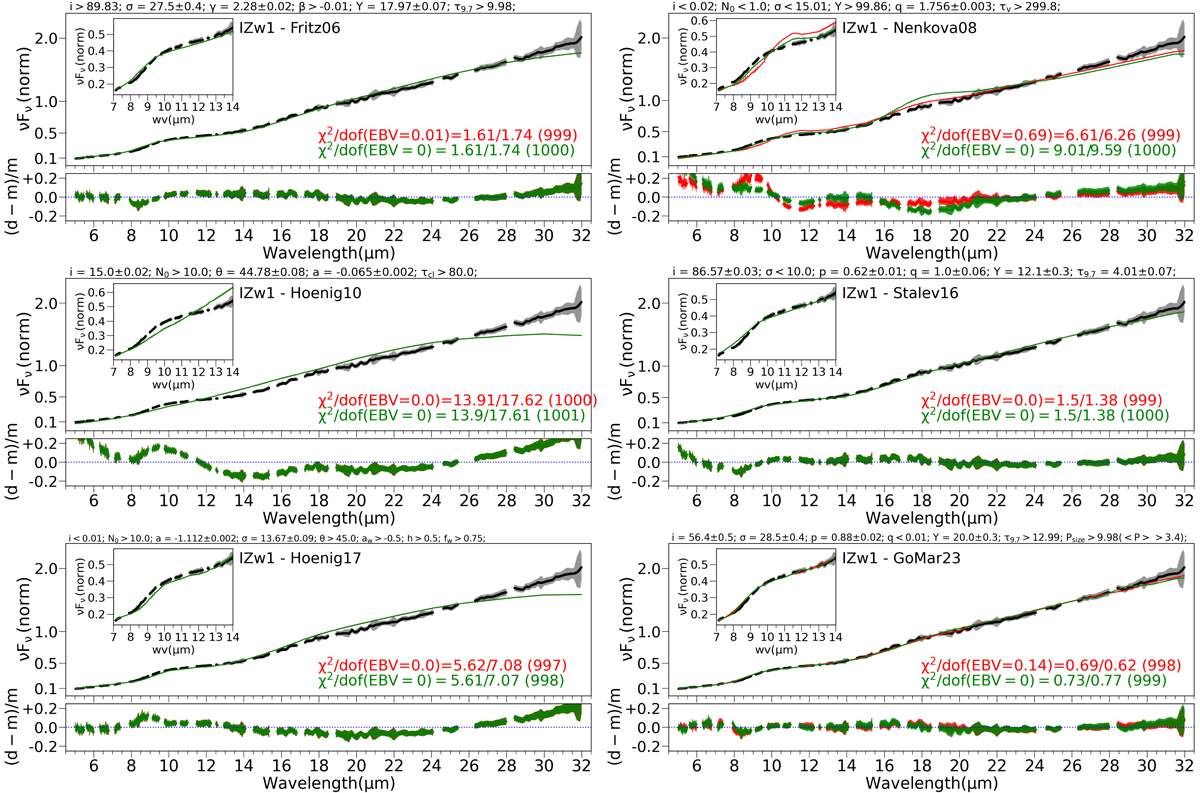
Fig. 7.
Download original image
Spectral fits obtained for the type-1 AGN IZw1. The black line and gray shaded areas show the Spitzer spectrum and its error bars, respectively. The red and green lines show the best SED for each model with and without foreground extinction, respectively (see text). The top panel shows the spectral fit and the bottom panel shows the residuals. The inset within the top panel shows zoom-in to the 7–14 μm wavelength range associated with the 9.7 μm silicate feature. Reduced χ2 is given at the bottom-right corner of the top panel (error/model), including the degree of freedom within brackets (red and green for the SED with and without foreground extinction). Above each panel, we show the resulting parameters for each model when foreground extinction is included.
Current usage metrics show cumulative count of Article Views (full-text article views including HTML views, PDF and ePub downloads, according to the available data) and Abstracts Views on Vision4Press platform.
Data correspond to usage on the plateform after 2015. The current usage metrics is available 48-96 hours after online publication and is updated daily on week days.
Initial download of the metrics may take a while.