Fig. 6.
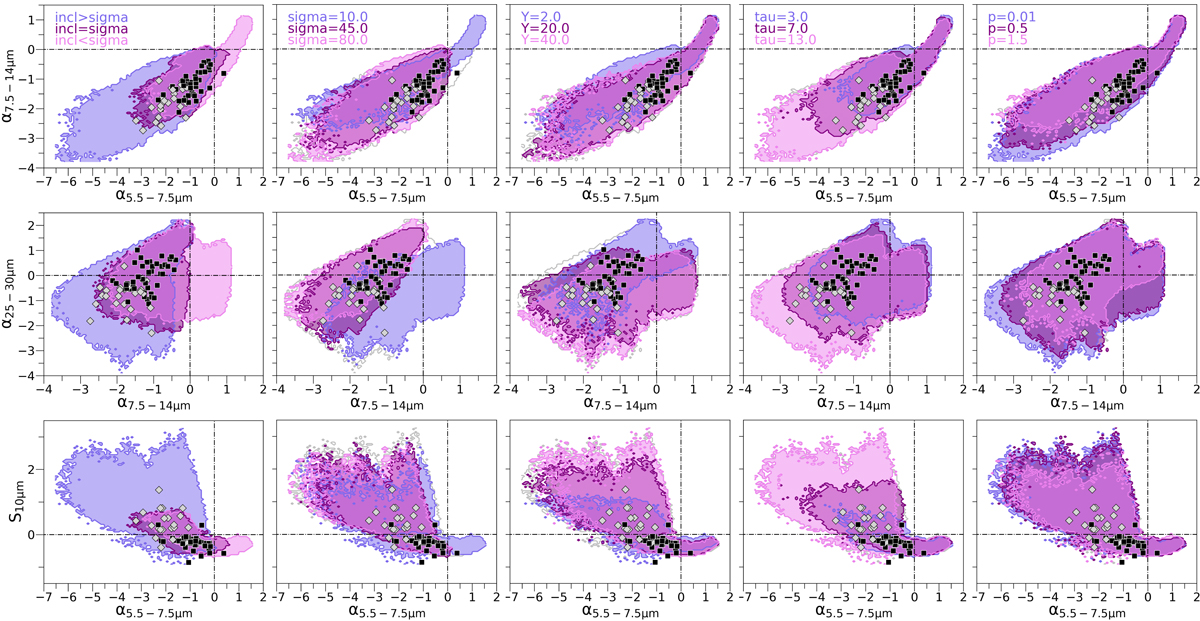
Download original image
Resulting diagrams for the GoMar23 model when the following parameters vary (from left to right): the viewing angle, the half opening angle, the ratio between the outer and the inner radius, the optical extinction at the equator, and the radial distribution of the dust. From top to bottom: α5.5 − 7.5 μm versus α7.5 − 14 μm, α25 − 30 μm versus α7.5 − 14 μm, and S10 μm versus α5.5 − 7.5 μm. The gray contour shows the result for the entire SED library. The blue, purple, and pink areas show the locus of SEDs for the minimum, medium, and maximum values of the parameter, respectively (see legend in the top panels). The results for the maximum grain size are shown in Fig. 5. We skip the results for the polar density distribution of the dust since no differences are found.
Current usage metrics show cumulative count of Article Views (full-text article views including HTML views, PDF and ePub downloads, according to the available data) and Abstracts Views on Vision4Press platform.
Data correspond to usage on the plateform after 2015. The current usage metrics is available 48-96 hours after online publication and is updated daily on week days.
Initial download of the metrics may take a while.