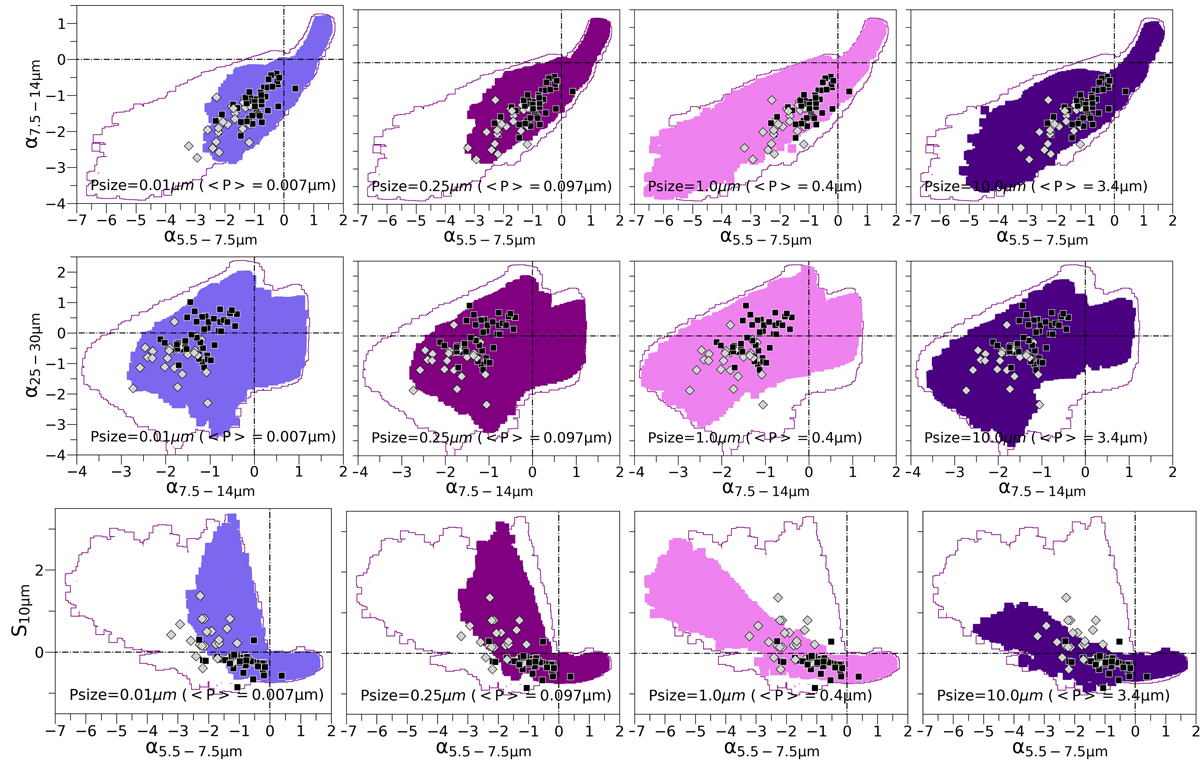
Fig. 5.
Download original image
Resulting diagrams for the GoMar23 model when the maximum grain size of the dust particles is explored (colored area) compared with the overall space parameter (empty area). From left to right the areas show the locus of SEDs for Psize = 0.01μm (⟨P⟩ = 0.007 μm, blue), Psize = 0.25 μm (⟨P⟩ = 0.097 μm, purple), Psize = 1.0 μm (⟨P⟩ = 0.36 μm, pink), and Psize = 10.0 μm (⟨P⟩ = 3.41 μm, violet). From top to bottom: α5.5 − 7.5 μm versus α7.5 − 14 μm, α25 − 30 μm versus α7.5 − 14 μm, and S10 μm versus α5.5 − 7.5 μm. Black squares and gray diamonds show the locus for type-1 AGN and type-2 AGN, respectively.
Current usage metrics show cumulative count of Article Views (full-text article views including HTML views, PDF and ePub downloads, according to the available data) and Abstracts Views on Vision4Press platform.
Data correspond to usage on the plateform after 2015. The current usage metrics is available 48-96 hours after online publication and is updated daily on week days.
Initial download of the metrics may take a while.