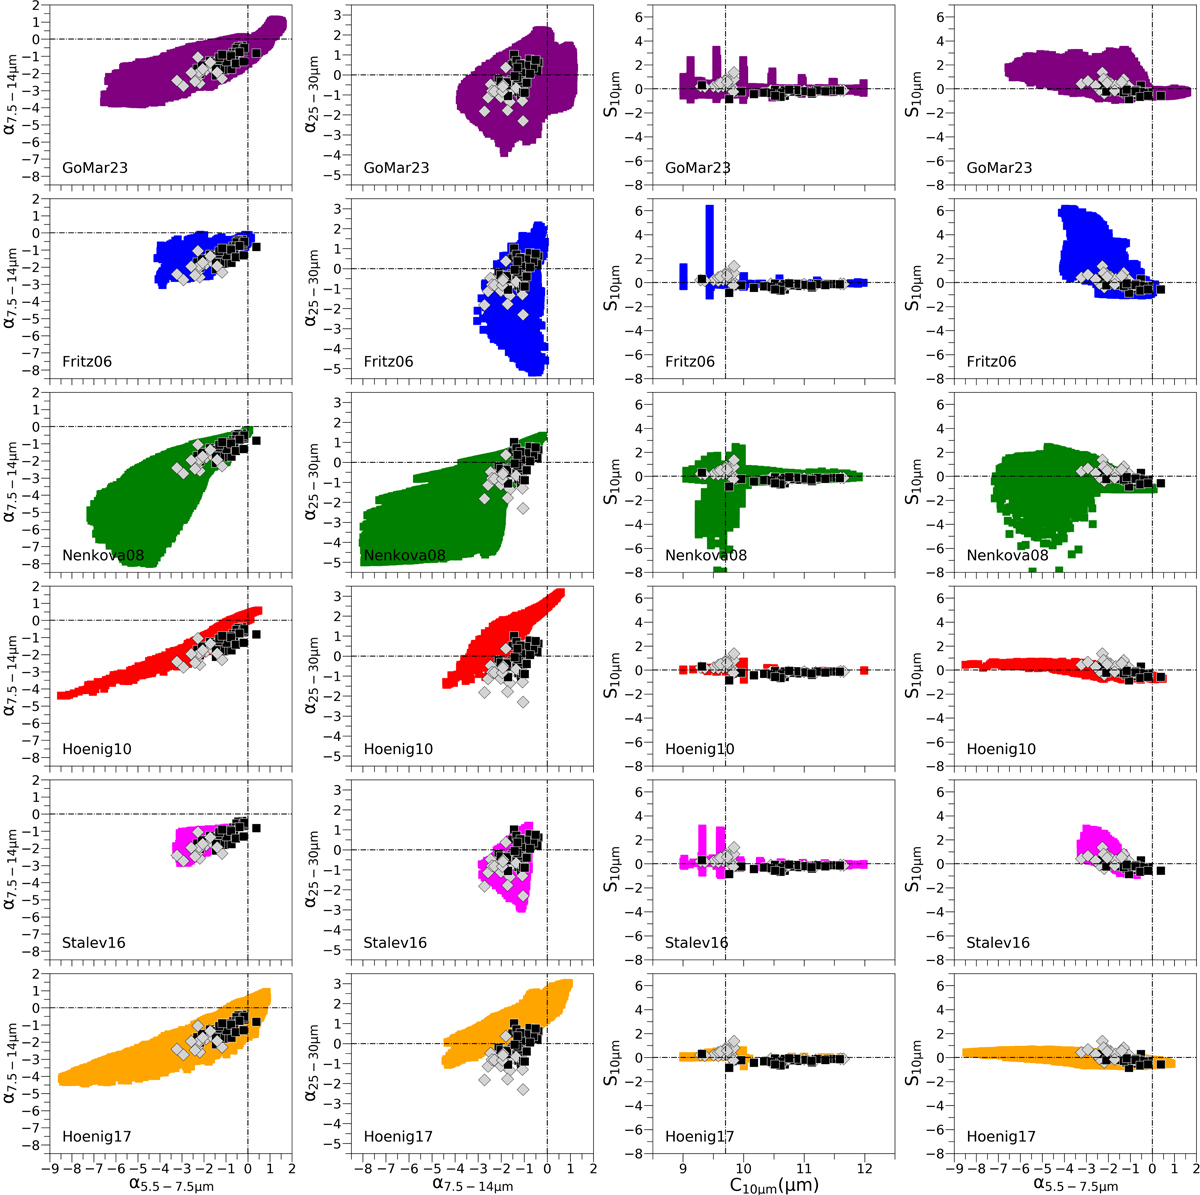
Fig. 4.
Download original image
Comparison between the spectral shapes of our AGN sample (black squares for type-1 AGN and gray diamonds for type-2 AGN) and the spectral shapes of the SED libraries. From left to right we show mid-infrared versus near-infrared slopes, far-infrared versus mid-infrared slopes, the 10 μm feature silicate strength versus its center, and the 10 μm feature silicate strength versus the near-infrared slope. From top to bottom we show the results for GoMar23 (purple), Fritz06 (blue), Nenkova08 (green), Hoenig10 (red), Stalev16 (magenta), and Hoenig17 (orange) models. Note that the tabulated values of the center of the silicate emission feature C10 μm in some of the models (e.g., Fritz06 or GoMar23 models) are an artifact of the spectral resolution used for to generate each SED library.
Current usage metrics show cumulative count of Article Views (full-text article views including HTML views, PDF and ePub downloads, according to the available data) and Abstracts Views on Vision4Press platform.
Data correspond to usage on the plateform after 2015. The current usage metrics is available 48-96 hours after online publication and is updated daily on week days.
Initial download of the metrics may take a while.