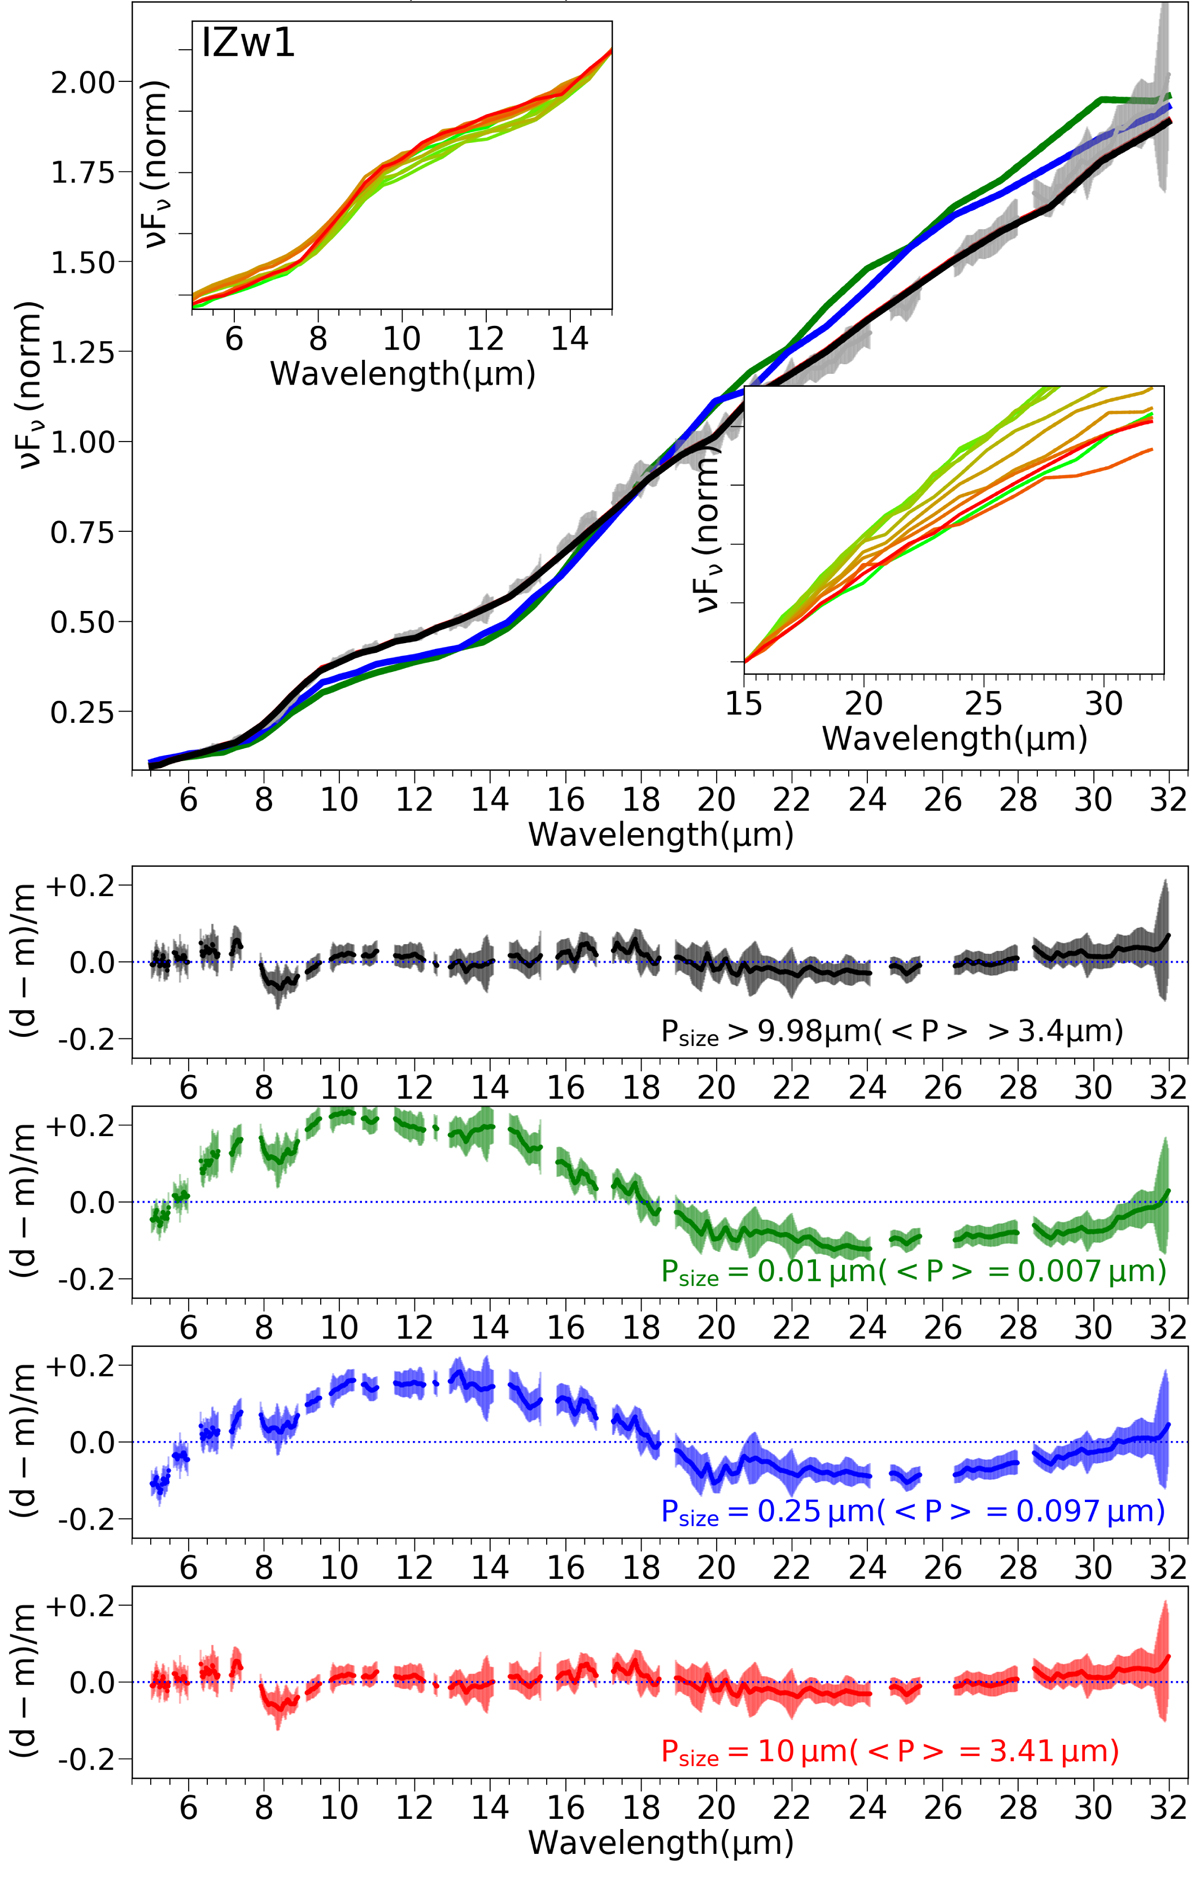
Fig. 13.
Download original image
Effect of the maximum grain size on the spectral fit. We use as examples the type-1 AGN IZw1. The first row shows the best spectral fit using GoMar23 model (black continuous line). We also show the fit to three fixed maximum grain size Psize of 0.01 μm (⟨P⟩ = 0.007 μm, green), 0.25 μm (⟨P⟩ = 0.097 μm, blue), and 10 μm (⟨P⟩ = 3.41 μm, red), while other parameters are kept as those obtained from the best fit. The two insets in these top panels show the set of SEDs with the same parameters and varying the maximum grain size Psize from 0.01 μm (⟨P⟩ = 0.007 μm, green) to 10 μm (⟨P⟩ = 3.41 μm, red). Note that in these insets the SEDs are normalized at 15 μm. Bottom panels show the residuals of the best fit (black) and those using dust maximum grain size Psize of 0.01 μm (⟨P⟩ = 0.007 μm, green), 0.25 μm (⟨P⟩ = 0.097 μm, blue), and 10 μm (⟨P⟩ = 3.41 μm, red).
Current usage metrics show cumulative count of Article Views (full-text article views including HTML views, PDF and ePub downloads, according to the available data) and Abstracts Views on Vision4Press platform.
Data correspond to usage on the plateform after 2015. The current usage metrics is available 48-96 hours after online publication and is updated daily on week days.
Initial download of the metrics may take a while.