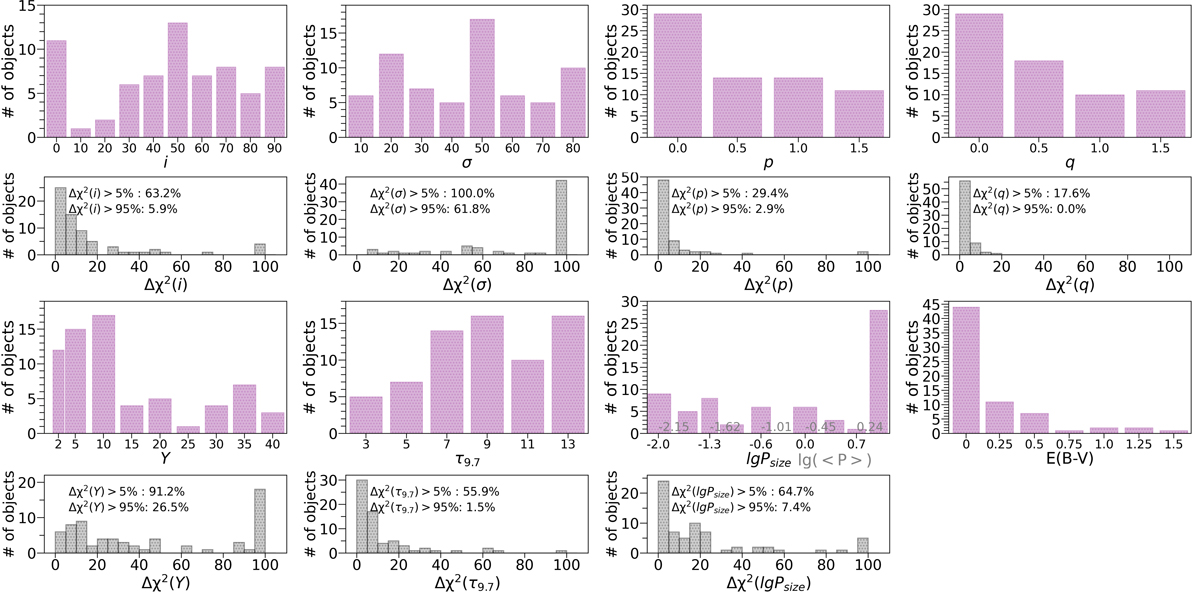
Fig. 12.
Download original image
Rows 1 and 3 show in purple the histograms of the resulting parameters for the AGN sample when using GoMar23 model. We use the same bins as those used for the SED grid. Rows 2 and 4 show the histogram of the relative importance of each parameter in the convergence of the fit. It is obtained as the maximal variation of χ2 for each parameter range compared to the parameter giving the maximum variation, denoted as Δχ2 (see Fig. 11). Each panel also shows the percentage of objects with Δχ2 above 5 and 95%.
Current usage metrics show cumulative count of Article Views (full-text article views including HTML views, PDF and ePub downloads, according to the available data) and Abstracts Views on Vision4Press platform.
Data correspond to usage on the plateform after 2015. The current usage metrics is available 48-96 hours after online publication and is updated daily on week days.
Initial download of the metrics may take a while.