Fig. 10.
Download original image
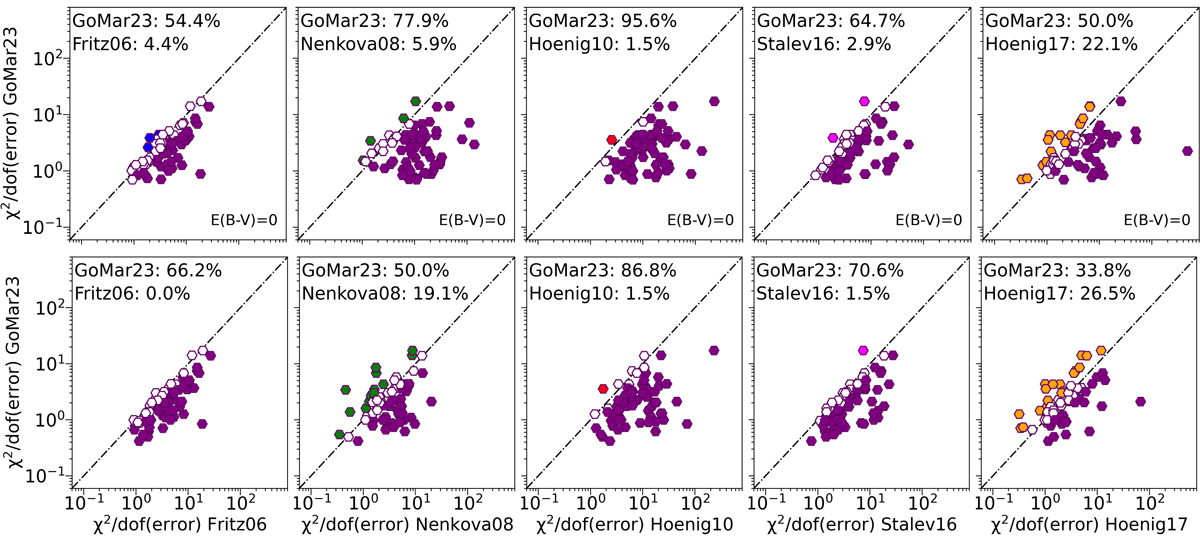
Comparison of ![]() (error) obtained with our new GoMar23 model and those previously reported in the literature. Open hexagons show results that are statistically similar according to the AIC probability. Purple-filled hexagons are marked when GoMar23 model is preferred over the compared model and other colors-filled hexagons are those objects that statistically prefer the compared model instead of GoMar23 model (color code as in previous plots). The dot-dashed line shows the 1:1 relation. In the left corner of each panel, we show the percentage of objects preferring GoMar23 model over the other model (top row) and the percentage of objects preferring the other model rather than GoMar23 model.
(error) obtained with our new GoMar23 model and those previously reported in the literature. Open hexagons show results that are statistically similar according to the AIC probability. Purple-filled hexagons are marked when GoMar23 model is preferred over the compared model and other colors-filled hexagons are those objects that statistically prefer the compared model instead of GoMar23 model (color code as in previous plots). The dot-dashed line shows the 1:1 relation. In the left corner of each panel, we show the percentage of objects preferring GoMar23 model over the other model (top row) and the percentage of objects preferring the other model rather than GoMar23 model.
Current usage metrics show cumulative count of Article Views (full-text article views including HTML views, PDF and ePub downloads, according to the available data) and Abstracts Views on Vision4Press platform.
Data correspond to usage on the plateform after 2015. The current usage metrics is available 48-96 hours after online publication and is updated daily on week days.
Initial download of the metrics may take a while.