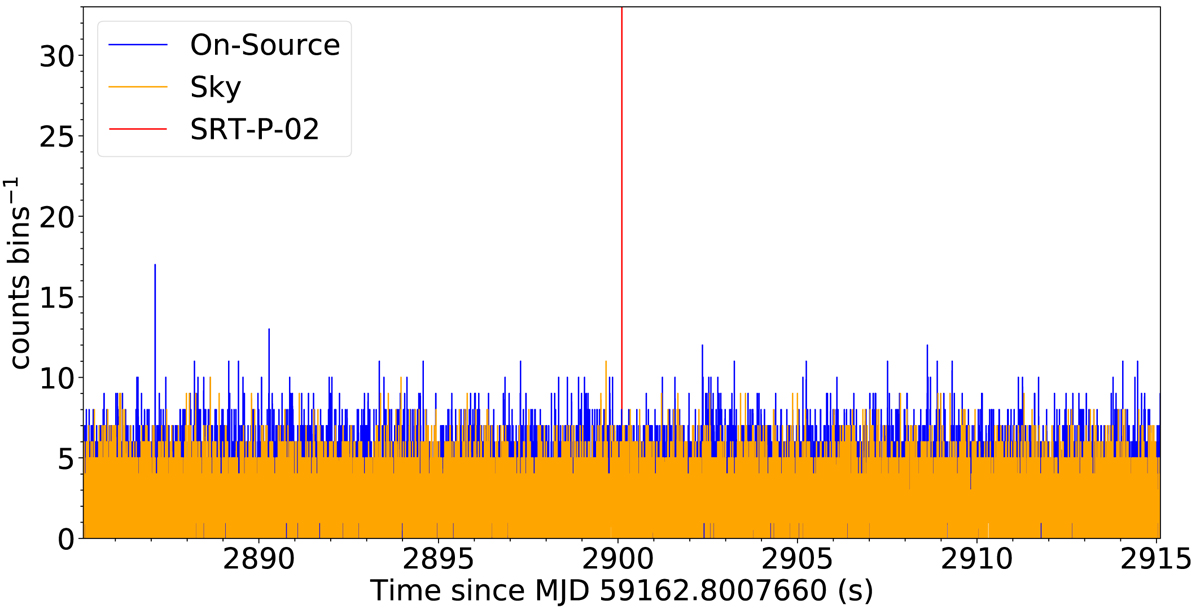
Fig. 6.
Download original image
Light curves (binned at 1 ms) of the on-source (blue) and sky (orange) detectors of the Aqueye+ observation corresponding to R3, taken on 2020/11/09 (Obs ID 20201109-200635 in Table A.1, the Aqueye+ starting time has been barycentred). An interval of ±15 s around the time of arrival of the burst SRT-P-02 (red vertical line) is shown.
Current usage metrics show cumulative count of Article Views (full-text article views including HTML views, PDF and ePub downloads, according to the available data) and Abstracts Views on Vision4Press platform.
Data correspond to usage on the plateform after 2015. The current usage metrics is available 48-96 hours after online publication and is updated daily on week days.
Initial download of the metrics may take a while.