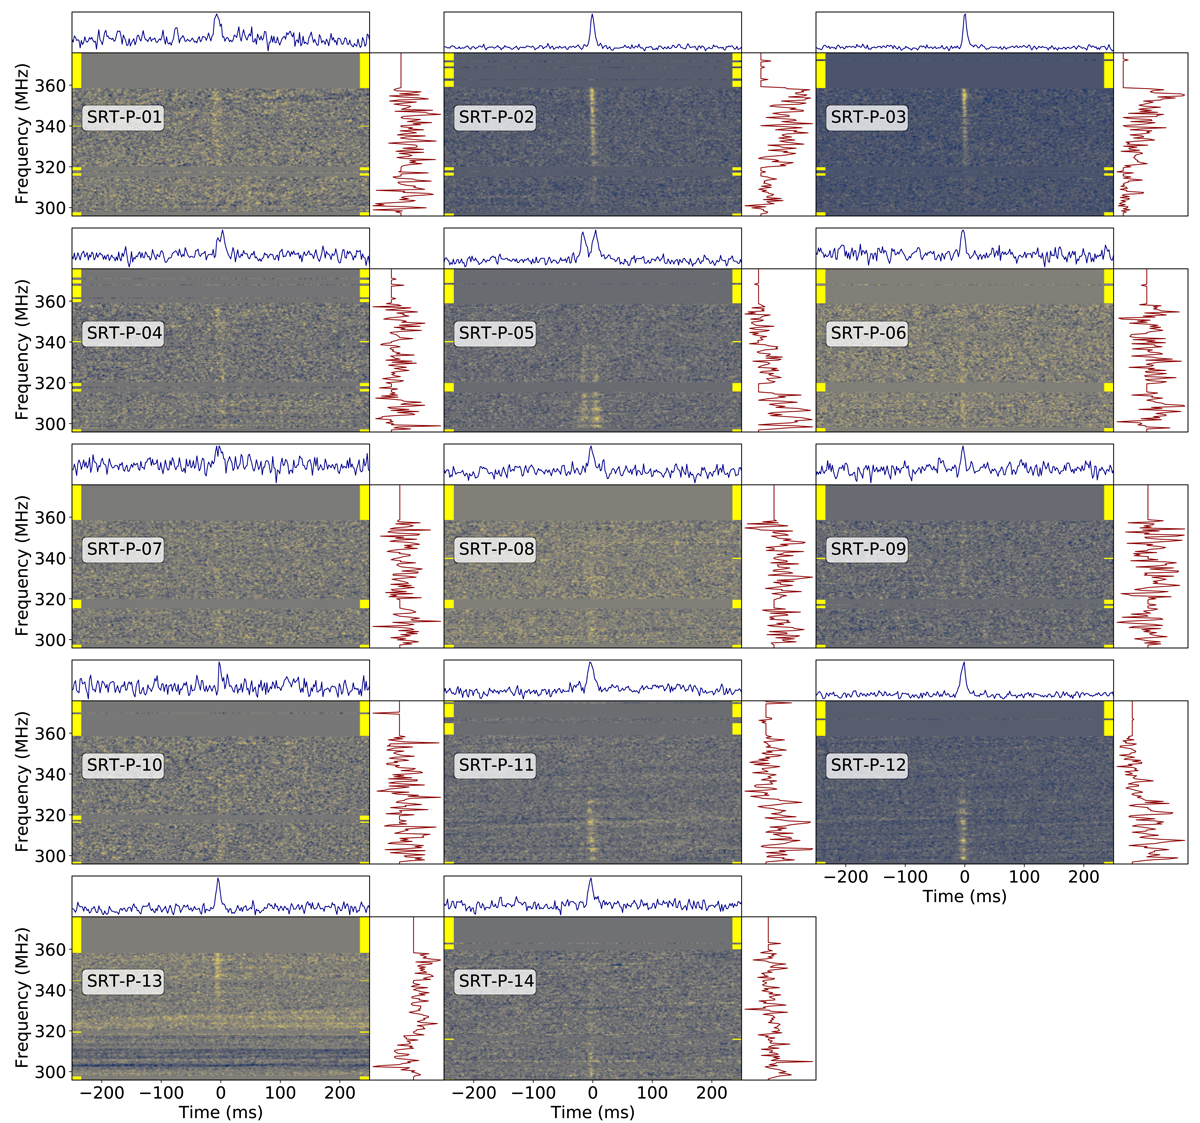
Fig. 3.
Download original image
Bursts detected with the SRT. The data have a resolution of 0.5 MHz in frequency and 1.9 ms in time. For each burst, the top panel shows the frequency-averaged time series. The central panel is the spectrogram of the signal and the right panel is the time averaged (around the width of the burst) spectrum. The rows with the yellow ticks are masked channels due to RFI.
Current usage metrics show cumulative count of Article Views (full-text article views including HTML views, PDF and ePub downloads, according to the available data) and Abstracts Views on Vision4Press platform.
Data correspond to usage on the plateform after 2015. The current usage metrics is available 48-96 hours after online publication and is updated daily on week days.
Initial download of the metrics may take a while.