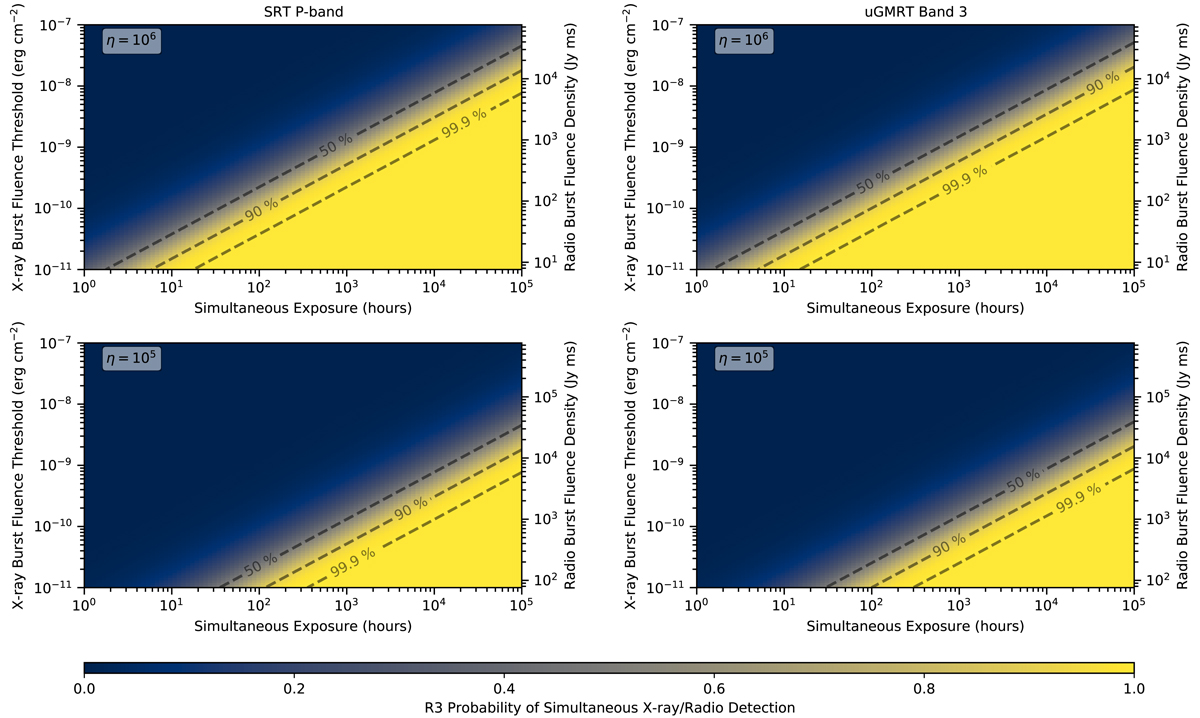
Fig. 10.
Download original image
Probability of detecting a X-ray/radio event given a certain X-ray/radio efficiency η observing in the radio band with the SRT-P (left) or the uGMRT Band 3 (right). Supposing that the event is above the fluence X-ray threshold (left y-axis) the colormap shows the probability of detecting a radio burst with radio fluence (right y-axis), constrained by the efficiency η, as a function of the simultaneous exposure (x-axis). The dashed lines represent the iso-probability contour plots for a probability of 50, 90, and 99.9 %.
Current usage metrics show cumulative count of Article Views (full-text article views including HTML views, PDF and ePub downloads, according to the available data) and Abstracts Views on Vision4Press platform.
Data correspond to usage on the plateform after 2015. The current usage metrics is available 48-96 hours after online publication and is updated daily on week days.
Initial download of the metrics may take a while.