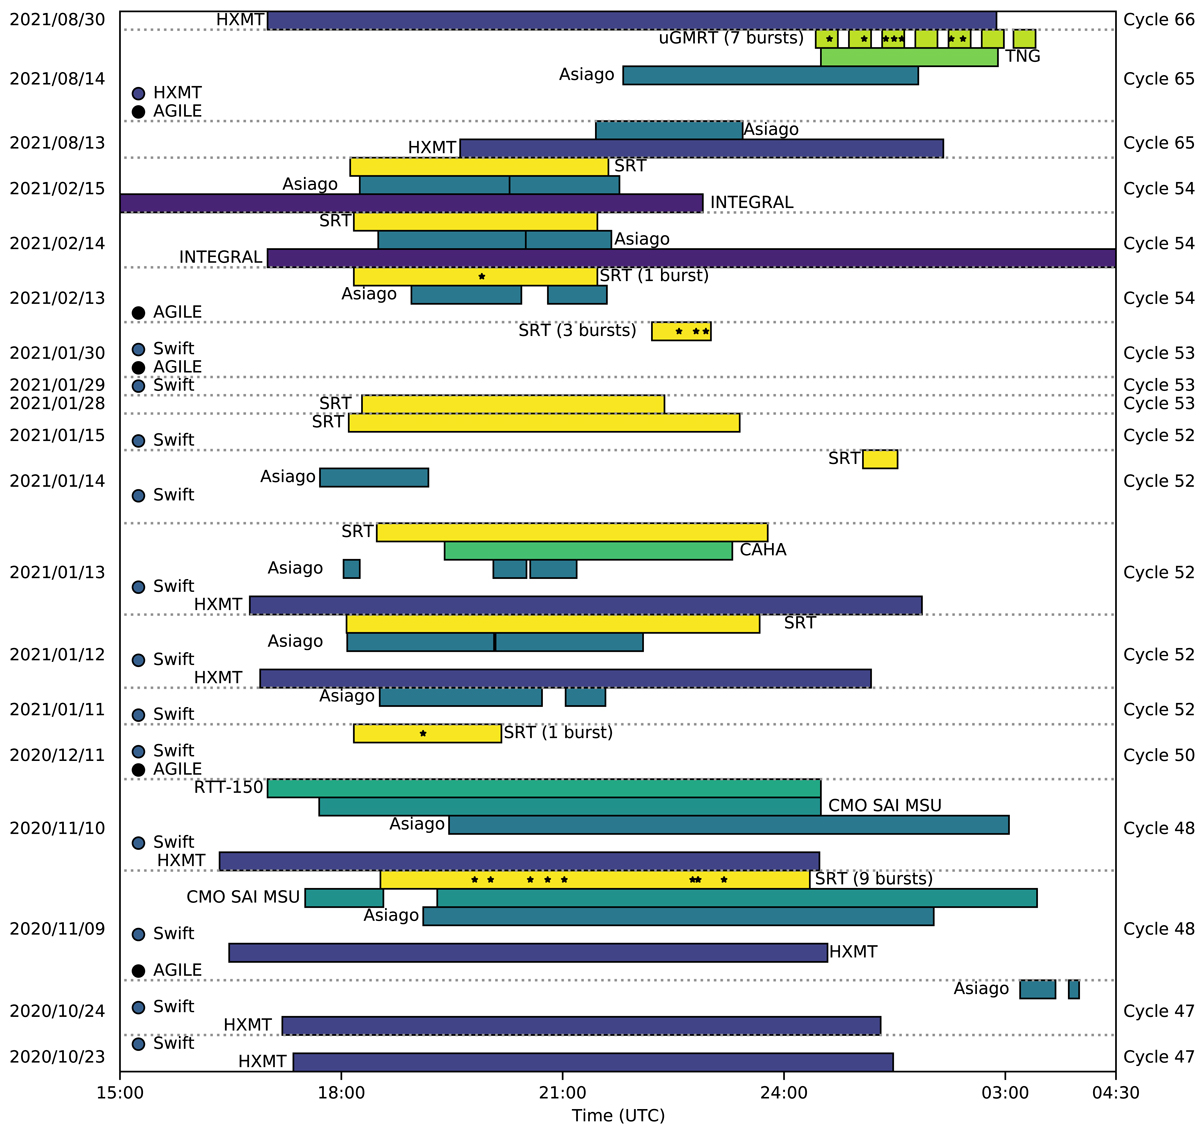
Fig. 1.
Download original image
Observational R3 MWL campaign. Coloured bars represent observations performed for each facility as a function of time of the day (UTC). For each day (reported on the left), the corresponding activity cycle number of R3 is reported on the right. The time after 24:00 should be considered as part of the day after. Each detected radio burst is reported as a black star. AGILE and Swift (and Insight–HXMT on 2021/08/14) were observing throughout the whole day, except during epochs of visibility limitations (Earth occultations and South Atlantic anomaly passages). The days in which a single instrument is present are scheduled days in which observations with other instruments have been cancelled.
Current usage metrics show cumulative count of Article Views (full-text article views including HTML views, PDF and ePub downloads, according to the available data) and Abstracts Views on Vision4Press platform.
Data correspond to usage on the plateform after 2015. The current usage metrics is available 48-96 hours after online publication and is updated daily on week days.
Initial download of the metrics may take a while.