Fig. 4
Download original image
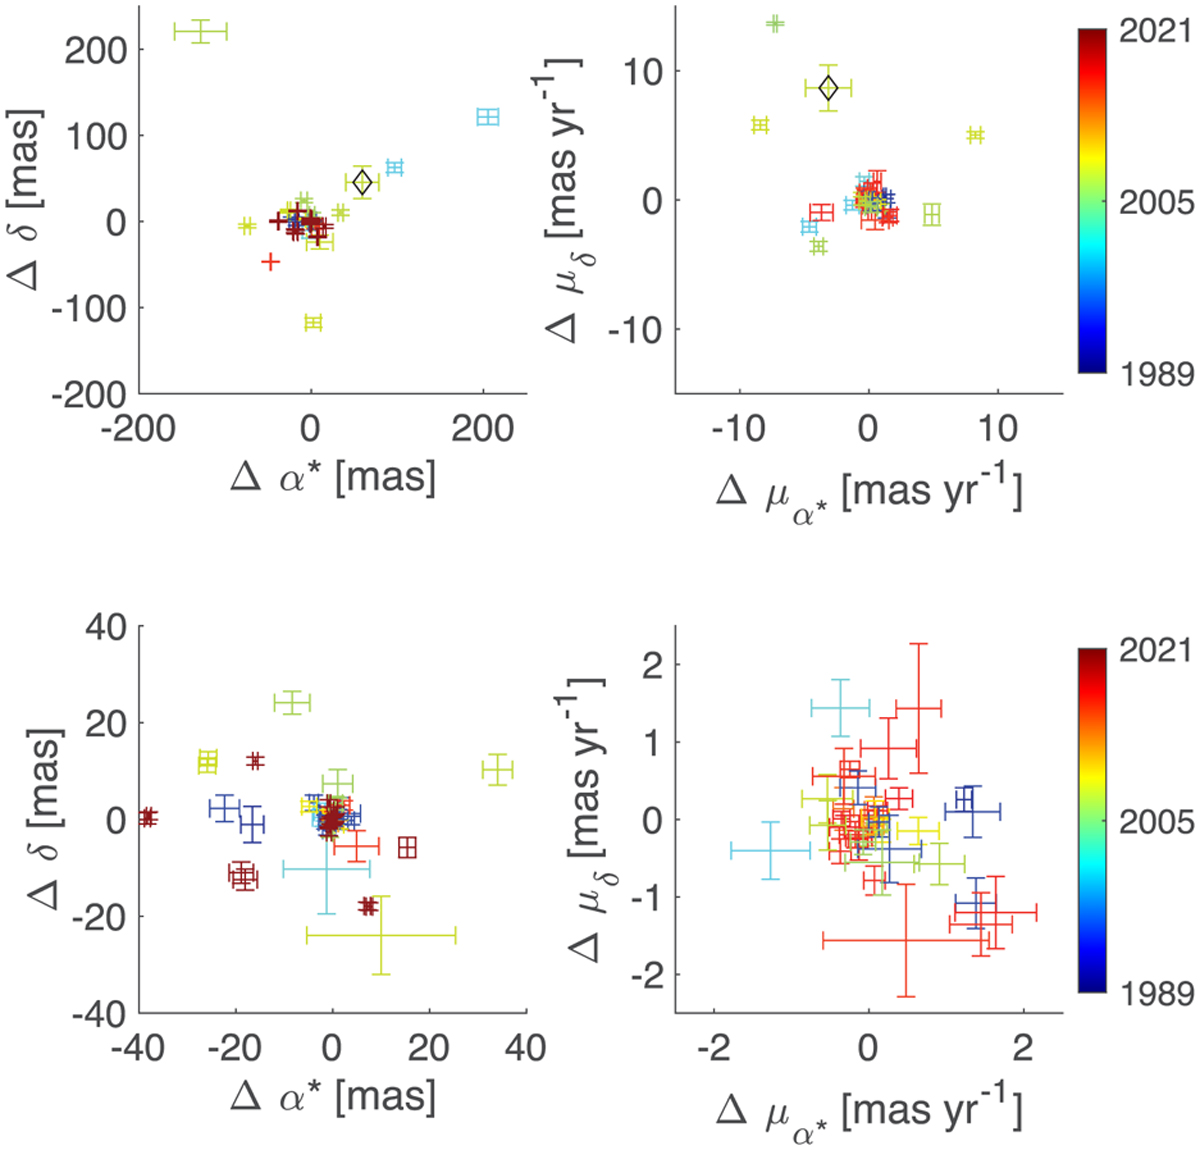
Residuals of the differences of the positions and proper motions between VLBI and Gaia after adjustment of the orientation and spin between the two reference frames. Results are given for the baseline solution of 55,DR2 described in Table E.4. Individual values are color coded by the epoch of the VLBI position. The lower plots show zoomedin views of the central area of the upper plots. The position residuals for T Tau and S Crt are not shown, as they are outside the plotted area. The residuals for VY CMa are marked with a black diamond.
Current usage metrics show cumulative count of Article Views (full-text article views including HTML views, PDF and ePub downloads, according to the available data) and Abstracts Views on Vision4Press platform.
Data correspond to usage on the plateform after 2015. The current usage metrics is available 48-96 hours after online publication and is updated daily on week days.
Initial download of the metrics may take a while.