| Issue |
A&A
Volume 675, July 2023
|
|
|---|---|---|
| Article Number | A79 | |
| Number of page(s) | 4 | |
| Section | Interstellar and circumstellar matter | |
| DOI | https://doi.org/10.1051/0004-6361/202346451 | |
| Published online | 04 July 2023 | |
The star in RNO 54: A possible post-FUor with a short faint jet
1
Byurakan Astrophysical Observatory,
0213
Aragatsotn prov., Armenia
e-mail: This email address is being protected from spambots. You need JavaScript enabled to view it.
2
Special Astrophysical Observatory,
N.Arhyz,
Karachaevo-Cherkesia
369167, Russia
e-mail: This email address is being protected from spambots. You need JavaScript enabled to view it.
Received:
18
March
2023
Accepted:
22
May
2023
Abstract
Aims. The aim of the present study is to analyze the spectra of an unusual pre-main sequence star in the cometary nebula RNO 54, which is suspected by several researchers to be a FUori-like object.
Methods. We performed long-slit spectroscopy of the star using the 6m telescope with the SCORPIO-2 multi-mode focal reducer.
Results. We discover a short (~4″ or ~6000 AU) and faint emission shock-excited jet from this star, probably oriented toward the long axis of the nebular ellipse. The spectral type of the star is estimated as G0-2 II; we confirm the split of the Li I absorption line, which is a typical sign indicating a FUori-like spectrum. Our analysis of the available data reveals an almost null photometric variability over at least the last 20 years. The lower limit of the bolometric luminosity of the star is estimated as 300 L⊙. Our study supports the classification of RNO 54 as a FUor-like star in the long post-outburst stage.
Key words: stars: pre-main sequence / stars: jets / stars: individual: RNO 54
© The Authors 2023
 Open Access article, published by EDP Sciences, under the terms of the Creative Commons Attribution License (https://creativecommons.org/licenses/by/4.0), which permits unrestricted use, distribution, and reproduction in any medium, provided the original work is properly cited.
This article is published in open access under the Subscribe to Open model. This email address is being protected from spambots. You need JavaScript enabled to view it. to support open access publication.
1 Introduction
The nebulous object RNO 54 was described for the first time in a list presented by Cohen (1980). It appears as a bright star on the edge of an elliptic loop-like reflection nebula. In the same catalog, the star was classified as F5 II, with Hα emission. Further attention was paid to this object by Goodrich (1987), who compared its morphology with ring-shaped nebulae near FUors. Herbig estimated the spectral type of the central star (early G Ib-II) on the basis of the higher-resolution spectra in the yellow–red range, as reported by Goodrich (1987).
This object is located on the edge of the dark cloud Dobashi 4549 (TGU 1314). Its central star was also identified as the infrared source IRAS 05393+2235, while in the 2MASS catalog it is designated as 2MASS J05422123+2236471. As the name RNO 54 refers to the nebulous object as a whole, below we use the designation 2MASS J05422123+2236471, referring to its central star.
The only spectrum of this object published so far is shown in the work of Torres et al. (1995). The authors point out the split of the Li I λ 6707 Å line as evidence in favor of the FUor-like nature of this star, and also present its spectral energy distribution (SED). This latter demonstrates significant far-infrared (far-IR) excess. Searches performed by these authors for extended shock-excited emission (i.e., Herbig-Haro knots or flows) in the vicinities of RNO 54 with the 2.6-m telescope of Byurakan observatory were unsuccessful. The same negative result was recently obtained by López et al. (2021). In the present work, we describe our new spectral observations of 2MASS J05422123+2236471.
2 Observations
We performed long-slit spectroscopy of 2MASS J05422123+2236471 with the SCORPIO-2 multi-mode focal reducer (Afanasiev & Moiseev 2011) at the Special Astrophysical Observatory of Russian Academy of Sciences (SAO RAS) 6 m telescope. We obtained two spectra on the nights of Nov. 25 and 26 and Dec. 30 and 31, 2021. The slit was oriented along the long axis of the nebula, with position angle PA = 10°. The total exposure times were 1200 and 720 s in nonphotometric atmospheric conditions, but with a relatively good seeing value ~1.1″ and 1.3″, respectively. The spectrograph’s slit with a width of 1″ and a length of 6′ gave a spectral resolution (FWHM) of about 2.5 Å in the spectral range 5580–7750 Å. The detector E2V CCD 261-84 with a format 4K × 2K was operated in 1 × 2 binning mode. This provides an angular scale along the axis of 0.4″ per px with a mean dispersion of 0.53 Å per px. The spectral data reduction was performed in a standard way using the IDL language based software as described in our previous papers (see, e.g., Egorov et al. 2018). It was not possible to perform the photometric calibration of the first spectrogram (Nov. 25) due to bad weather conditions, but this spectrogram was still used for the radial velocity measurements.
3 Results
In Fig.1 we present the spectrum of 2MASS J05422123+2236471 obtained on Dec. 30, 2021. It is rich with narrow absorption lines and has emission only in Hα line. Comparison with the spectral library of Jacoby et al. (1984) shows that the spectral type of this star corresponds to the slightly reddened early G supergiant, which is in full accordance with the earlier estimate made by Herbig (see Sect. 1). It should be noted that in addition to stellar lines, the diffuse interstellar band λ 6284 Å, which is well detached from the atmospheric absorption λ 6279 Å, is prominent in the spectrum of 2MASS J05422123+2236471.
We measured equivalent widths and radial velocities for several lines to compare them with the numerical data and the Hα line profile published by Torres et al. (1995). Their similarity is remarkable, and there have only been minimal changes over the past 30 yr. We present several enlarged fragments in Fig. 2.
The structure of the Hα emission line remains double-peaked, although the central depression no longer reaches continuum. The equivalent width of Hα emission is 4 Å (3 Å in 1995). Its full width corresponds to ≈900 km s−1 (800 km s−1 previously). The radial velocities (this paper uses heliocentric velocities because the systemic radial velocity is small; see below) of Hα components are −7 km s−1 (redward emission), −180 km s−1 (blueward emission), and −139 km s−1 (central depression). The corresponding values, roughly estimated from the Fig. 2b of Torres et al. (1995), are +50, −185, and −81 km s−1. We also note the definite existence of one more emission component in the blue wing of Hα with a radial velocity of about −450 km s−1 (this can probably also be seen in the spectrum shown by Torres et al. 1995).
The split of Li I absorption is also clearly visible in our spectra. The equivalent width of the Li I λ 6708 Å absorption line is 0.25 Å, and its components are split by about 45 km s−1. The radial velocity of this line as a whole is about +7 km s−1. This value should be compared with −6 km s−1 measured by Torres et al. (1995). It can be assumed that the systemic radial velocity is small and within measurement errors. On the other hand, NaD lines in the spectrum of 2MASS J05422123+2236471 are narrow and sharp, with a radial velocity of +20 km s−1, and do not show any traces of internal structure. A more detailed analysis of the line profiles and radial velocities would require spectra of higher resolution.
An unexpected result of our long-slit spectroscopy was the discovery of the short and faint emission jet near the northern side of the star. The jet is visible in the Hα, [N II], [S II], and [O I] lines, which confirms its shock-excited nature. Most likely, the jet is oriented along the axis of the elliptic nebula. Its length does not exceed 4.5″. The intensity of jet emissions is so low that, in Fig. 3 where these emissions are shown, they are even fainter than the fluctuations in the subtracted stellar continuum. No evidence of a counter-jet or of the inner structure of the jet emissions were found.
We measured the radial velocity of each emission line of the jet separately. All forbidden lines ([O I] λ 6300 Å, [N II] λ 6583 Å, [S II] λλ 6716 and 6731 Å) have almost the same radial velocity with a mean value of − 119 ± 3 km s−1. The Hα emission in the jet has somewhat lower radial velocity: −85 ± 18 km s−1. The mean FWZI (full width at zero intensity) of the jet emission is 193 ± 19 km s−1 for the forbidden lines and 265 km s−1 for Hα. This difference in widths and velocities may be attributed to the well-known existence of a large velocity dispersion in the bow-shocks in the heads of the flows (e.g., Reipurth & Bally 2001), where the Hα emission is brighter. The mixing of jet emission and dust-scattered stellar Hα emission is also likely to affect the radial velocity. In any case, the velocity of the jet is very close to the radial velocity of the central depression in the Hα line.
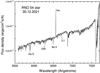 |
Fig. 1 Spectrum of 2MASS J05422123+2236471. |
4 Discussion and conclusions
The characteristics of 2MASS J05422123+2236471 (Hα emission, conspicuous Li I line, shock-excited jet, loop-like nebula indicating the presence of circumstellar dust disk) fully confirm its pre-main sequence (PMS) nature. However, knowledge of its luminosity is required in order to define its classification more precisely. One must also take into account that if this star is indeed a FU Ori type object after outburst, it cannot be considered a “normal” star. Indeed, according to the currently most successful model (e.g., Hartmann & Kenyon 1996; Audard et al. 2014, and references therein), 2MASS J05422123+2236471 should be surrounded by a dense disk, which plays the role of an extended atmosphere. The split in the Li line can be attributed to the existence of such a disk (see examples in Miller et al. 2011; Hillenbrand et al. 2018).
We have compiled the available photometric estimates in the optical range in the Table 1. We note the excellent agreement between the photometry of Torres et al. (1995) and the APASS data as well as the obvious discrepancy between the Tycho 2 catalog and the data provided by other authors: the brightness in B and V differs by 1.5–2 mag and even the B – V index is lower by 1 mag in Tycho 2. The reason for this discrepancy may be due to ongoing photometric variability of the star and/or to measurement errors (e.g., caused by close nebulosity around the star, which very probably also affected the photographic photometry in the gSC-2.3 catalog). This question should be solved by further photometric observations.
The only long-term photometric observations of this object were performed during the INTEGRAL-OMC programme (Alfonso-Garzón et al. 2012). These observations show that the brightness of the star remains remarkably constant during the period from 2003 to 2010 with a mean value of V = 13.12 mag and variations ranging from 12.94 to 13.25 mag. This mean magnitude value fully agrees with the APASS and Torres et al. (1995) data. A recent search of the OMC archive shows that, of the 5821 data points accumulated up until 2022, the behavior of the star did not change. Only two single measurements with V ≈ 12.4 and 11.4 stand out from the others and their reliability is questionable. Based on these data, we conclude that 2MASS J05422123+2236471 has very minimal photometric variability, if any at all.
To evaluate its absolute magnitude in the optical range, we require knowledge of the distance, approximate spectral type, and interstellar reddening. However, the various estimates of the interstellar extinction for this object are not in agreement. The extinction map of Rowles & Froebrich (2009) gives AV ≈ 1.6−2.0 mag for the area around the source. The appearance of the stellar continuum also points to the existence of a moderate extinction on the line of sight. Assuming the spectral type of the star as G0 II and taking the intrinsic colors from the table of Schmidt-Kaler (1982), we derived AV ≈ 2.5–3.0 mag from the BV photometry of Torres et al. (1995) and APASS. In comparison, photometry from the Tycho 2 catalog suggests a very low (near zero) value of AV, which seems improbable.
The currently accepted distance of 2MASS J05422123+2236471 was determined fairly reliably from the Gaia Early Data Release 3 (EDR3) parallax. The catalog of Bailer-Jones et al. (2021) provides distance estimates of 1387 pc (geometric) and 1396 pc (photogeometric). Using the trigonometric parallax value from Gaia DR3 (0.7163±0.0238 mas) and applying a systematic error correction, we obtain 1360± 40 pc. All these estimates agree well with each other, notwithstanding the slightly high renormalised unit weight error (RUWE) value of 1.46, which is probably a result of the close nebulosity around the star.
Assuming 1400 pc for the distance of the star and AV = 2.7 mag, we get MV = −0.3 for V = 13.12, or LV ≈ 110 L⊙ correspondingly. These are only lower limit estimates, because this object demonstrates significant near- and middle-IR emission. In addition, the true AV value may be higher given the very possible circumstellar extinction. In any case, these values put the central star of RNO 54 between the luminosity classes II and III, and suggest its jet will be of a linear size of about 6000 AU.
The recent astrophysical data presented in Gaia Data Release 3 (DR3) and computed from a modeling of the BP/RP spectra suggest an even higher luminosity for 2MASS J05422123+2236471. In particular, the following parameters should be noted: Teff = 6700 K, log g = 2.32, extinction of AV = 4.14m (we obtained this value by converting from the ARP using the approach suggested by Wang & Chen 2019), MG = −2.48, and L = 778 L⊙. However, these data are based on the assumption that modeled stars are “normal”, which is definitely not the case for 2MASS J05422123+2236471. Therefore, the distance of 1913 pc computed from this model is clearly exaggerated, as are the absolute magnitude and luminosity of the star.
Using the Vizier Photometry viewer, we constructed the SED of this object (Fig. 4) and compared it with the SED presented in the work of Torres et al. (1995). The new SED is based on a greater number of data points, but shows remarkable similarity to the previous one. As can be seen, the star shows obvious IR excess, although this drops in the far-IR wavelengths, making its SED typical for Class II sources. Alternatively, according to the models and terms of Robitaille et al. (2006), these characteristics suggest a middle-mass object in the evolutionary Stage II with a significant contribution from disk emission. We estimated the lower limit of its bolometric luminosity by integrating the SED, and obtain a value of Lbol = 250 L⊙. It should be noted that Torres et al. (1995) also made a similar estimation from their SED, obtaining a value of about 1.5−2 L⊙ for an arbitrary distance of 100 pc. Taking into account the real distance of RNO 54, we derive a value of Lbol = 300−400 L⊙ based on the calculations of these latter authors. On the basis of all of the above-mentioned findings, we believe 300 L⊙ to be a reasonable conservative estimate for the bolometric luminosity of the central object RNO 54; this includes the radiation from the star itself as well as that from the circumstellar disk. The value obtained is lower than the mean luminosity of HAeBe stars (the spectral type is also too late); on the other hand, the star is much more luminous than the T Tau stars.
A question naturally arises as to whether or not this object indeed belongs to FUori-like objects, that is, to FUors long after the outburst, as was suggested by Goodrich (1987) and Torres et al. (1995). We consider a FUori-like nature to be very probable. The arguments in favor of this consideration are the following: spectral type (late F to early G); the narrow absorptions and other spectral features (e.g., Bail blend near λ6496 Å) typical for supergiants and particularly for FUors; the split in the Li I line; the absence of emission lines, except for weak Hα; and the near absence of changes in stellar brightness. The most important factors, in our opinion, are the existence of the shock-excited collimated outflow and the significant bolometric luminosity, which are characteristic of many FUor and FUor-like objects (see, e.g., Audard et al. 2014). One can see that the properties of 2MASS J05422123+2236471 are in agreement with four of the seven main FUor features listed in Magakian et al. (2022). However, it should be stressed that no outburst has ever been observed.
The only significant counterargument to such a classification is the absence of conspicuous, wide, and strongly blueshifted P Cyg-type absorptions, which are usually observed in the spectra of FUors, but are not visible in the 2MASS J05422123+2236471 spectrum. However, recent studies of FUors, FUor-like stars, and intermediate objects reveal a notable variety in their spectra. The small and rather faint jet observed in the RNO 54 system, as well as the lack of more distant Herbig-Haro knots, may indicate that the star has been in a post-outburst state after the FUori event for a significant time (possibly several hundred years or more), during which the intensity of outflow substantially lowered. Therefore, it could have lost some of the characteristics typically associated with classical FUors. The unfavorable orientation of the remains of the expanding shell toward the line of sight cannot be excluded either.
No observational data are yet available to check whether or not CO absorption bands exist in the near-IR spectrum of RNO 54. Such data could also be used to detect a possible gradual change in its spectral type with wavelength. The existence of its low-amplitude variability should also be analyzed with the aid of more precise photometry. Equally, we have no explanation for the discrepant data of the Tycho 2 mission.
In summary, we believe that the discovery of a faint emission jet and the confirmation of significant luminosity noticeably increase the likelihood that the star RNO 54 belongs to the population of FUor-like objects.
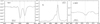 |
Fig. 2 Enlarged fragments of the spectrum of 2MASS J05422123+2236471, showing the profiles of Na D, Hα, and Li I lines. We note the sharpness of the sodium lines and the split in the lithium line. The laboratory wavelengths are indicated by short-dashed lines. |
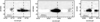 |
Fig. 3 Emission lines of the jet from the star RNO 54: [S II], Hα + [N II], and [O I]. The continuum spectrum of the star is subtracted. The broad Hα emission in the stellar spectrum is also prominent; other details in continuum are only the fluctuations after subtraction. The laboratory wavelengths are indicated by dashed lines. The blueshift of the jet emissions is clearly seen. |
2MASS J05422123+2236471 photometry.
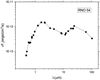 |
Fig. 4 Spectral energy distribution of 2MASS J05422123+2236471, built on the basis of the data taken from PanSTARRS, Gaia, SDSS, 2MASS, WISE, AKARI, MSX, and IRAS surveys. |
Acknowledgements
Authors are grateful to referee for many helpful comments, which improved the paper. Authors thank Prof. A.S. Rastorguev for valuable advice. This work was partly supported by RA State Committee of Science, in the frames of the research project 21T-1C031. The spectroscopic observations on the unique scientific facility “Big Telescope Alt-azimuthal” of SAO RAS, as well as the data reduction, were financially supported by grant No 075-15-2022-262 (13.MNPMU.21.0003) of the Ministry of Science and Higher Education of the Russian Federation. This work uses results from the European Space Agency (ESA) space mission Gaia. Gaia data are being processed by the Gaia Data Processing and Analysis Consortium (DPAC). Funding for the DPAC is provided by national institutions, in particular the institutions participating in the Gaia MultiLateral Agreement (MLA). This work also uses the data from the OMC Archive at CAB (INTA-CSIC), pre-processed by ISDC and further processed by the OMC Team at CAB. The OMC Archive is part of the Spanish Virtual Observatory project. Both are funded by MCIN/AEI/10.13039/501100011033 through grants PID2020-112949GB-I00 and PID2019-107061GB-C61, respectively. This research has made use of the VizieR catalogue access tool, CDS, Strasbourg, France.
References
- Afanasiev, V. L., & Moiseev, A. V. 2011, Balt. Astron., 20, 363 [NASA ADS] [Google Scholar]
- Alfonso-Garzón, J., Domingo, A., Mas-Hesse, J.M., & Giménez, A. 2012, A&A, 548, A79 [NASA ADS] [CrossRef] [EDP Sciences] [Google Scholar]
- Audard, M., Ábrahám, P., Dunham, M. M., et al. 2014, in Protostars and Planets VI eds. H. Beuther et al. (Tucson: University of Arizona Press), 387 [Google Scholar]
- Bailer-Jones, C. A. L., Rybizki, J., Fouesneau, M., et al. 2021, AJ, 161, 147 [NASA ADS] [CrossRef] [Google Scholar]
- Cohen, M. 1980, AJ, 85, 29 [Google Scholar]
- Egorov, O. V., Lozinskaya, T. A., Moiseev, A. V., & Smirnov-Pinchukov, G. V. 2018, MNRAS, 478, 3386 [NASA ADS] [CrossRef] [Google Scholar]
- Goodrich, R. W. 1987, PASP, 99, 116 [Google Scholar]
- Hartmann, L., & Kenyon, S. J. 1996, ARA&A, 34, 207 [NASA ADS] [CrossRef] [Google Scholar]
- Hillenbrand, L. A., Contreras Peña, C., Morrell, S., et al. 2018, ApJ, 869, 146 [NASA ADS] [CrossRef] [Google Scholar]
- Jacoby, G. H., Hunter, D. A., & Christian, C. A. 1984, ApJS, 56, 257 [NASA ADS] [CrossRef] [Google Scholar]
- López, R., Riera, A., Estalella, R., & Gómez G. 2021, A&A, 648, A57 [NASA ADS] [CrossRef] [EDP Sciences] [Google Scholar]
- Magakian, T. Yu., Movsessian, T. A., & Andreasyan, H. R. 2022, Acta Astrophys. Tau, 3, 4 [Google Scholar]
- Miller, A. A., Hillenbrand, L. A., Covey, K. R., et al. 2011, ApJ, 730, 80 [NASA ADS] [CrossRef] [Google Scholar]
- Reipurth, B., & Bally, J. 2001, ARA&A, 39, 403 [Google Scholar]
- Robitaille, T. P., Whitney, B. A., Indebetouw, R. et al. 2006, ApJS, 167, 256 [NASA ADS] [CrossRef] [Google Scholar]
- Rowles, J., & Froebrich, D. 2009, MNRAS, 395, 1640 [CrossRef] [Google Scholar]
- Schmidt-Kaler, T. H. 1982, Stars and Star Clusters, in New Series, Group VI, Landolt-Börnstein, 2b, eds. K. Schaifers, & H. H. Voigt (New York: Springer) [Google Scholar]
- Torres, C. A. O., Quast, G., de la Reza, R., Gregorio-Hetem, J., & Lépine, J. R. D. 1995, AJ, 109, 2146 [NASA ADS] [CrossRef] [Google Scholar]
- Wang, S., & Chen, X., 2019, ApJ, 877, 116 [Google Scholar]
All Tables
All Figures
|
Fig. 1 Spectrum of 2MASS J05422123+2236471. |
| In the text | |
|
Fig. 2 Enlarged fragments of the spectrum of 2MASS J05422123+2236471, showing the profiles of Na D, Hα, and Li I lines. We note the sharpness of the sodium lines and the split in the lithium line. The laboratory wavelengths are indicated by short-dashed lines. |
| In the text | |
|
Fig. 3 Emission lines of the jet from the star RNO 54: [S II], Hα + [N II], and [O I]. The continuum spectrum of the star is subtracted. The broad Hα emission in the stellar spectrum is also prominent; other details in continuum are only the fluctuations after subtraction. The laboratory wavelengths are indicated by dashed lines. The blueshift of the jet emissions is clearly seen. |
| In the text | |
|
Fig. 4 Spectral energy distribution of 2MASS J05422123+2236471, built on the basis of the data taken from PanSTARRS, Gaia, SDSS, 2MASS, WISE, AKARI, MSX, and IRAS surveys. |
| In the text | |
Current usage metrics show cumulative count of Article Views (full-text article views including HTML views, PDF and ePub downloads, according to the available data) and Abstracts Views on Vision4Press platform.
Data correspond to usage on the plateform after 2015. The current usage metrics is available 48-96 hours after online publication and is updated daily on week days.
Initial download of the metrics may take a while.