Fig. 3
Download original image
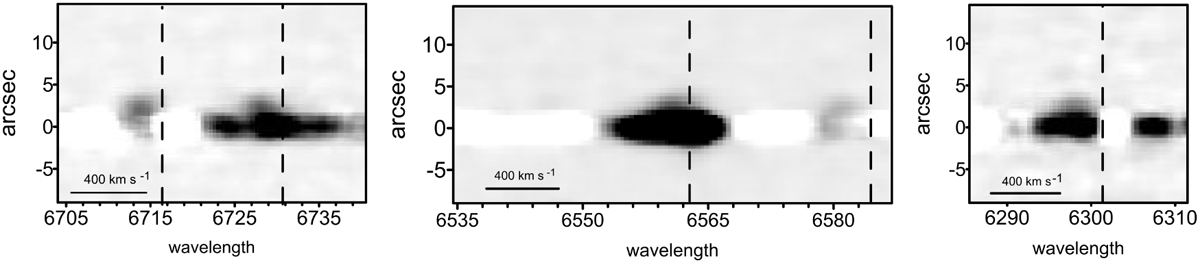
Emission lines of the jet from the star RNO 54: [S II], Hα + [N II], and [O I]. The continuum spectrum of the star is subtracted. The broad Hα emission in the stellar spectrum is also prominent; other details in continuum are only the fluctuations after subtraction. The laboratory wavelengths are indicated by dashed lines. The blueshift of the jet emissions is clearly seen.
Current usage metrics show cumulative count of Article Views (full-text article views including HTML views, PDF and ePub downloads, according to the available data) and Abstracts Views on Vision4Press platform.
Data correspond to usage on the plateform after 2015. The current usage metrics is available 48-96 hours after online publication and is updated daily on week days.
Initial download of the metrics may take a while.