Open Access
Fig. 2
Download original image
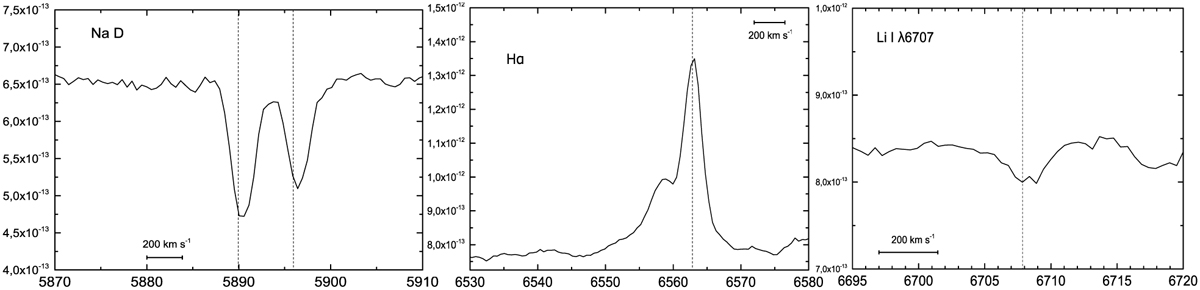
Enlarged fragments of the spectrum of 2MASS J05422123+2236471, showing the profiles of Na D, Hα, and Li I lines. We note the sharpness of the sodium lines and the split in the lithium line. The laboratory wavelengths are indicated by short-dashed lines.
Current usage metrics show cumulative count of Article Views (full-text article views including HTML views, PDF and ePub downloads, according to the available data) and Abstracts Views on Vision4Press platform.
Data correspond to usage on the plateform after 2015. The current usage metrics is available 48-96 hours after online publication and is updated daily on week days.
Initial download of the metrics may take a while.