Fig. 2.
Download original image
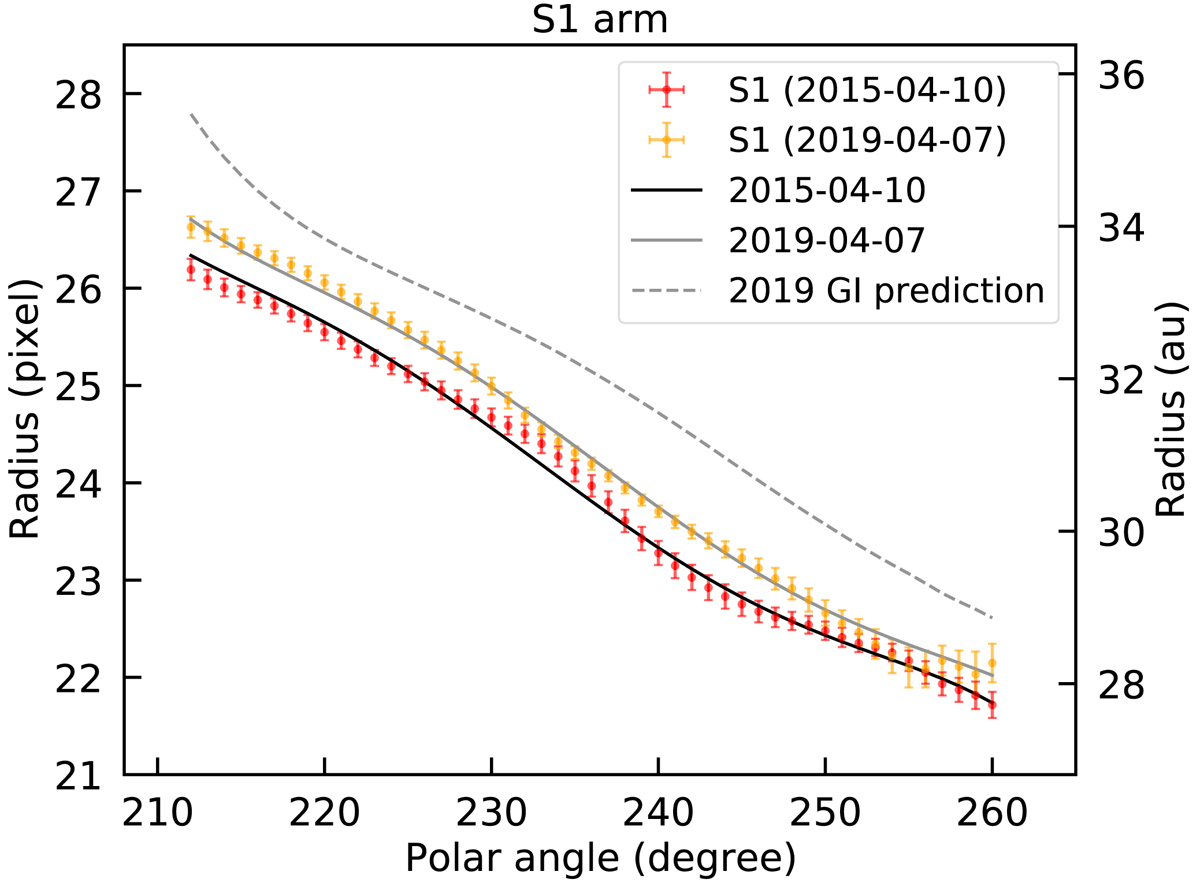
Peak locations of spiral arm S1 in polar coordinates after correction for viewing geometry. The solid curves represent the best-fit model spiral for the peak locations (dot points) between 2015 and 2019, assuming the companion-driven scenario. The derived angular velocities of spiral pattern motion are ![]() yr−1. The uncertainty estimation is presented in Appendix D. The 2019 observations significantly deviate from the gravitational instability prediction (dashed curve), adopting a central star of 1.7 M⊙.
yr−1. The uncertainty estimation is presented in Appendix D. The 2019 observations significantly deviate from the gravitational instability prediction (dashed curve), adopting a central star of 1.7 M⊙.
Current usage metrics show cumulative count of Article Views (full-text article views including HTML views, PDF and ePub downloads, according to the available data) and Abstracts Views on Vision4Press platform.
Data correspond to usage on the plateform after 2015. The current usage metrics is available 48-96 hours after online publication and is updated daily on week days.
Initial download of the metrics may take a while.