Fig. 8
Download original image
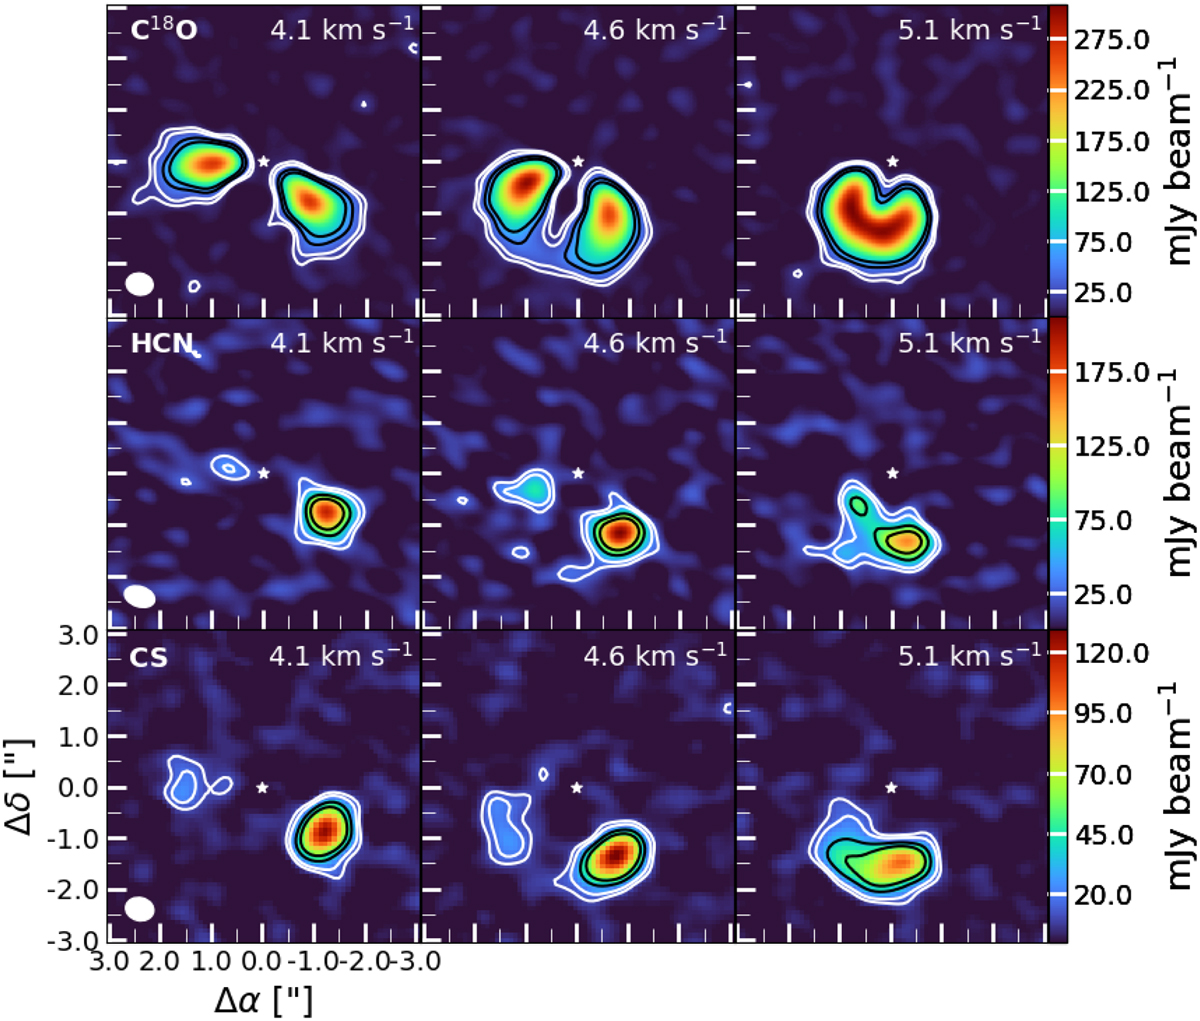
Zoomed-in image of the 4.1–5.1 km s−1 region of the channel maps of C18O J = 3−2 (top), HCN J = 4−3 (middle), and CS J = 7−6 transitions. The C18O channel maps show symmetric emission, while the channel maps of HCN and CS are both clearly asymmetric. The resolving beam is displayed in the lower left and the white star in the centre indicates the inferred location of the host star. The white contours indicate the 3σ and 5σ RMS levels, while the black contours show the 10σ and 15σ RMS levels.
Current usage metrics show cumulative count of Article Views (full-text article views including HTML views, PDF and ePub downloads, according to the available data) and Abstracts Views on Vision4Press platform.
Data correspond to usage on the plateform after 2015. The current usage metrics is available 48-96 hours after online publication and is updated daily on week days.
Initial download of the metrics may take a while.