Open Access
Fig. 6
Download original image
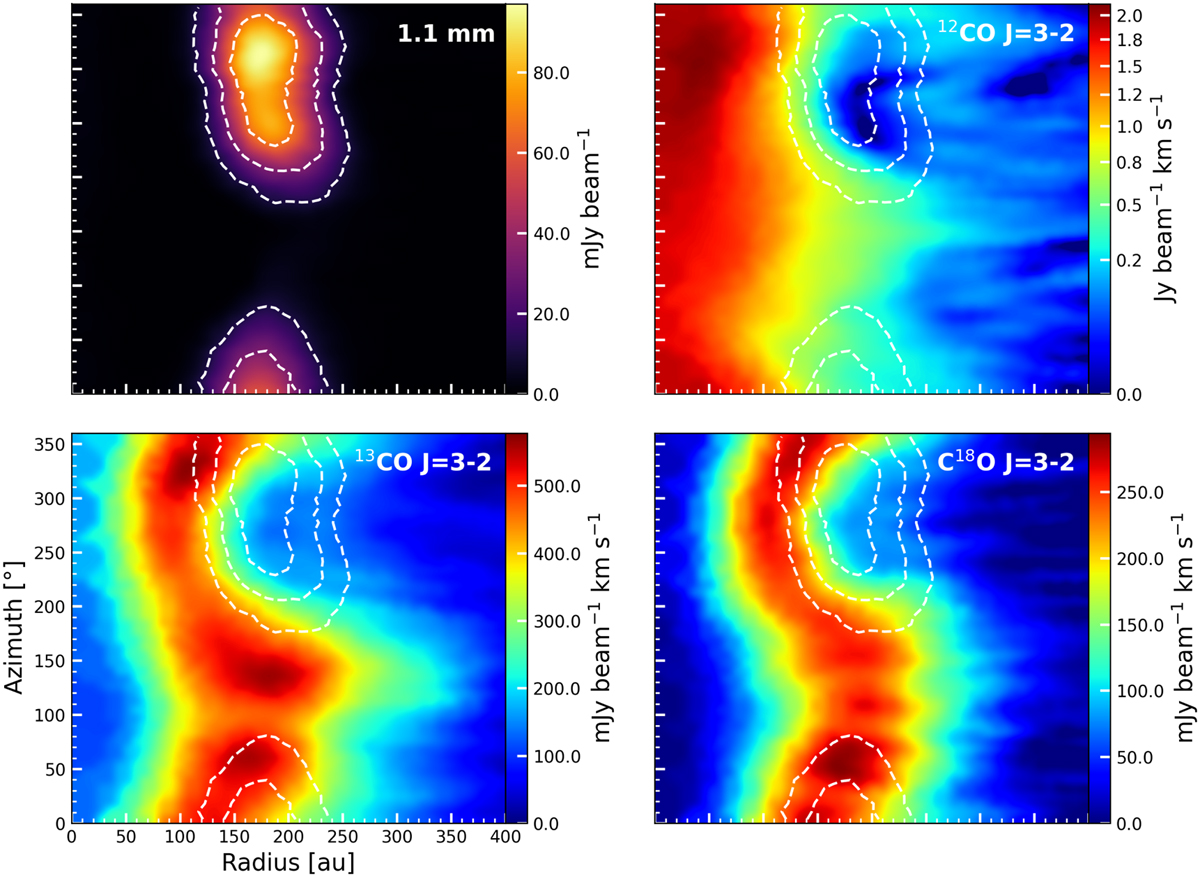
Deprojected moment-zero maps of the continuum and the major CO isotopologues. As in Fig. 1, the 12CO emission is presented using a power-law scaling with a power of 0.5. The white dashed contour lines indicate the location of the continuum emission.
Current usage metrics show cumulative count of Article Views (full-text article views including HTML views, PDF and ePub downloads, according to the available data) and Abstracts Views on Vision4Press platform.
Data correspond to usage on the plateform after 2015. The current usage metrics is available 48-96 hours after online publication and is updated daily on week days.
Initial download of the metrics may take a while.