Open Access
Fig. 4
Download original image
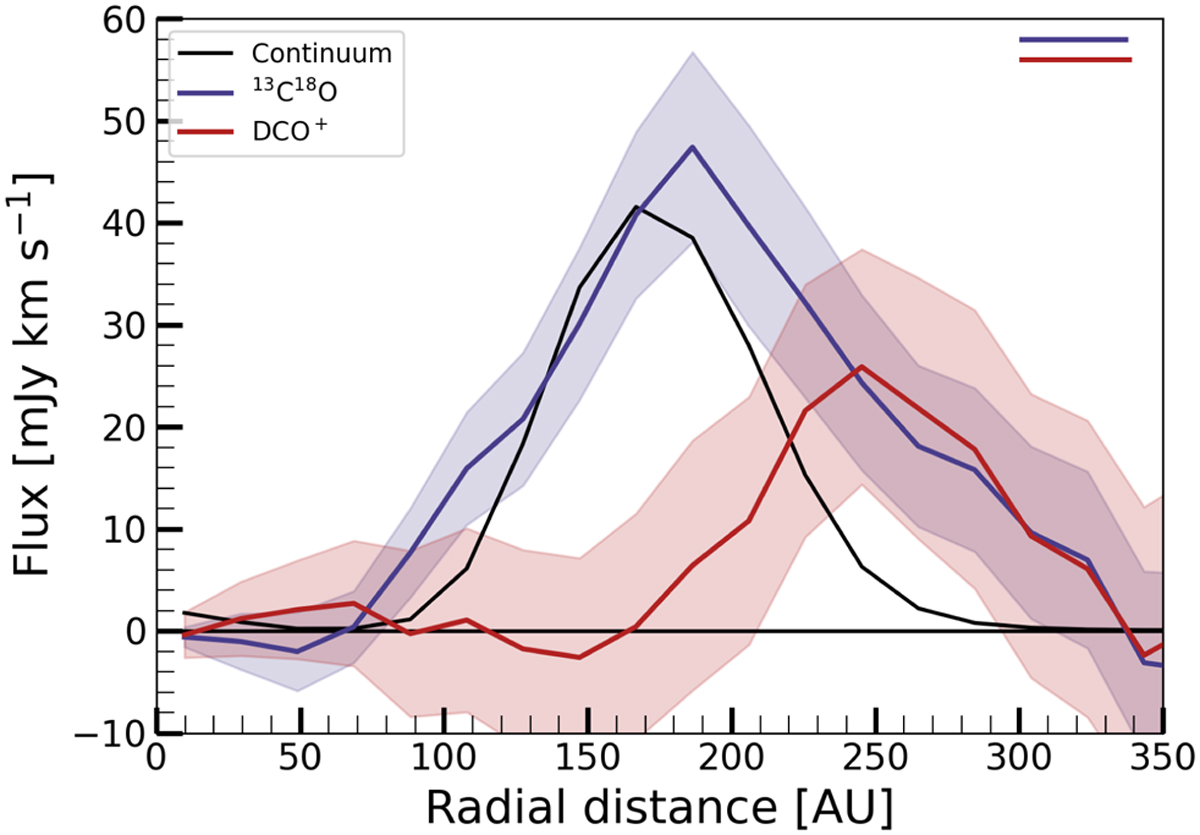
Azimuthally averaged deprojected radial profiles of 13C18O (in blue) and DCO+ (in red), shown together with the continuum emission (black profile). The shaded areas are the errors on the profiles. The two horizontal bars in the top right indicate the size of the minor axis for 13C18O (blue) and DCO+ (red).
Current usage metrics show cumulative count of Article Views (full-text article views including HTML views, PDF and ePub downloads, according to the available data) and Abstracts Views on Vision4Press platform.
Data correspond to usage on the plateform after 2015. The current usage metrics is available 48-96 hours after online publication and is updated daily on week days.
Initial download of the metrics may take a while.