Fig. 2
Download original image
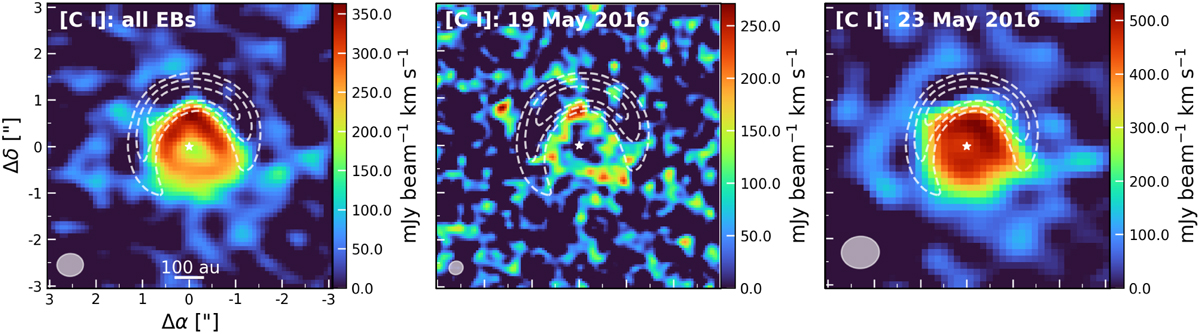
Moment-zero maps of the [C I] 3P1−3P0 transition. From left to right are shown the three execution blocks, the higher angular resolution observations from 19 May 2016, and the other two observations from 23 May 2016. The beams are indicated in the lower left, the white star in the centre shows the inferred location of the host star, and the white dashed contours indicate the location of the continuum emission.
Current usage metrics show cumulative count of Article Views (full-text article views including HTML views, PDF and ePub downloads, according to the available data) and Abstracts Views on Vision4Press platform.
Data correspond to usage on the plateform after 2015. The current usage metrics is available 48-96 hours after online publication and is updated daily on week days.
Initial download of the metrics may take a while.