Fig. C.1
Download original image
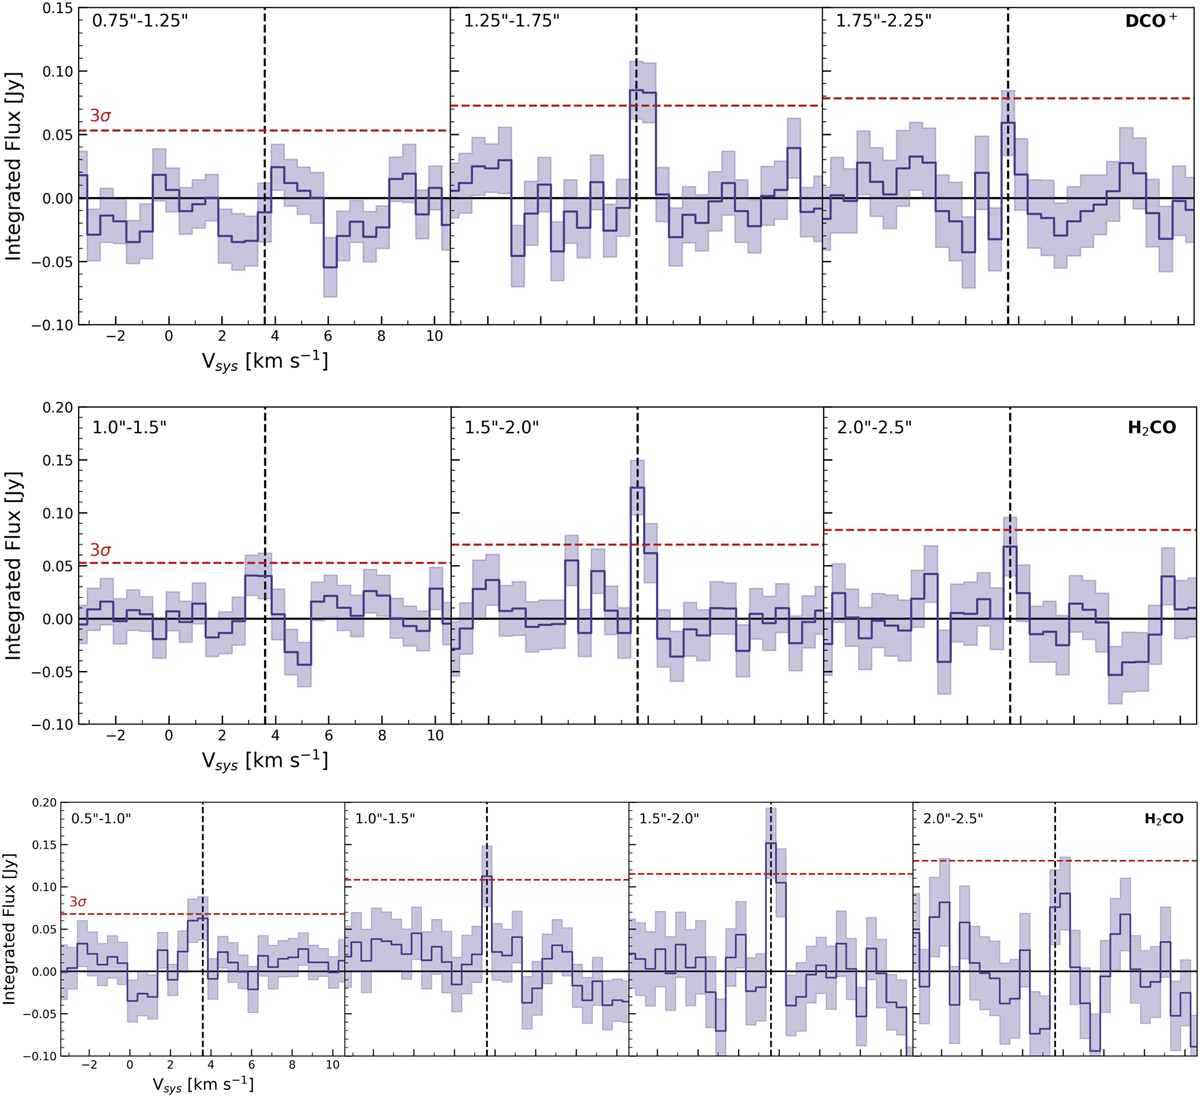
Spectra acquired from different radial regimes with GoFish. The radial regimes for each spectrum are indicated in the top left. From top to bottom are shown DCO+ J=4-3, H2CO J=42,3-32,2, and H2CO J=42,2-32,1. The horizontal red dashed line in each spectrum indicates the 3σ RMS level, while the vertical black dashed line indicates the systemic velocity of 3.6 km s−1.
Current usage metrics show cumulative count of Article Views (full-text article views including HTML views, PDF and ePub downloads, according to the available data) and Abstracts Views on Vision4Press platform.
Data correspond to usage on the plateform after 2015. The current usage metrics is available 48-96 hours after online publication and is updated daily on week days.
Initial download of the metrics may take a while.