Fig. B.1
Download original image
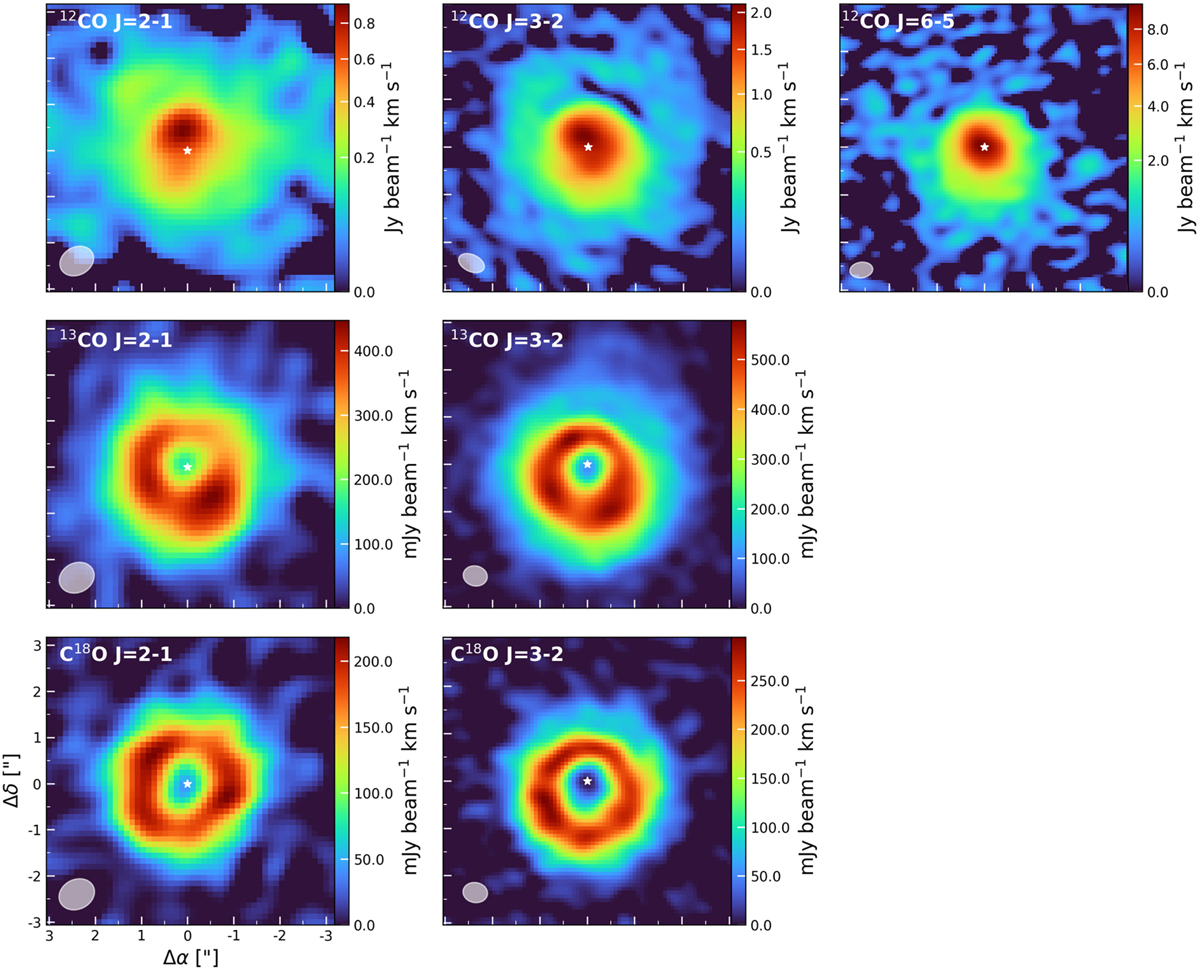
Moment-zero maps of the observed CO isotopologue transitions. From top to bottom are shown the 12CO, 13CO, and C18O isotopologues, while from left to right are shown the J=2-1, J=3-2, and J=6-5 transitions. The beams are displayed in the lowerleft, while the approximate location of the host star is given by the white star. The 12CO colour maps are displayed using a power-law scaling with an exponent of 0.5.
Current usage metrics show cumulative count of Article Views (full-text article views including HTML views, PDF and ePub downloads, according to the available data) and Abstracts Views on Vision4Press platform.
Data correspond to usage on the plateform after 2015. The current usage metrics is available 48-96 hours after online publication and is updated daily on week days.
Initial download of the metrics may take a while.