Fig. 1
Download original image
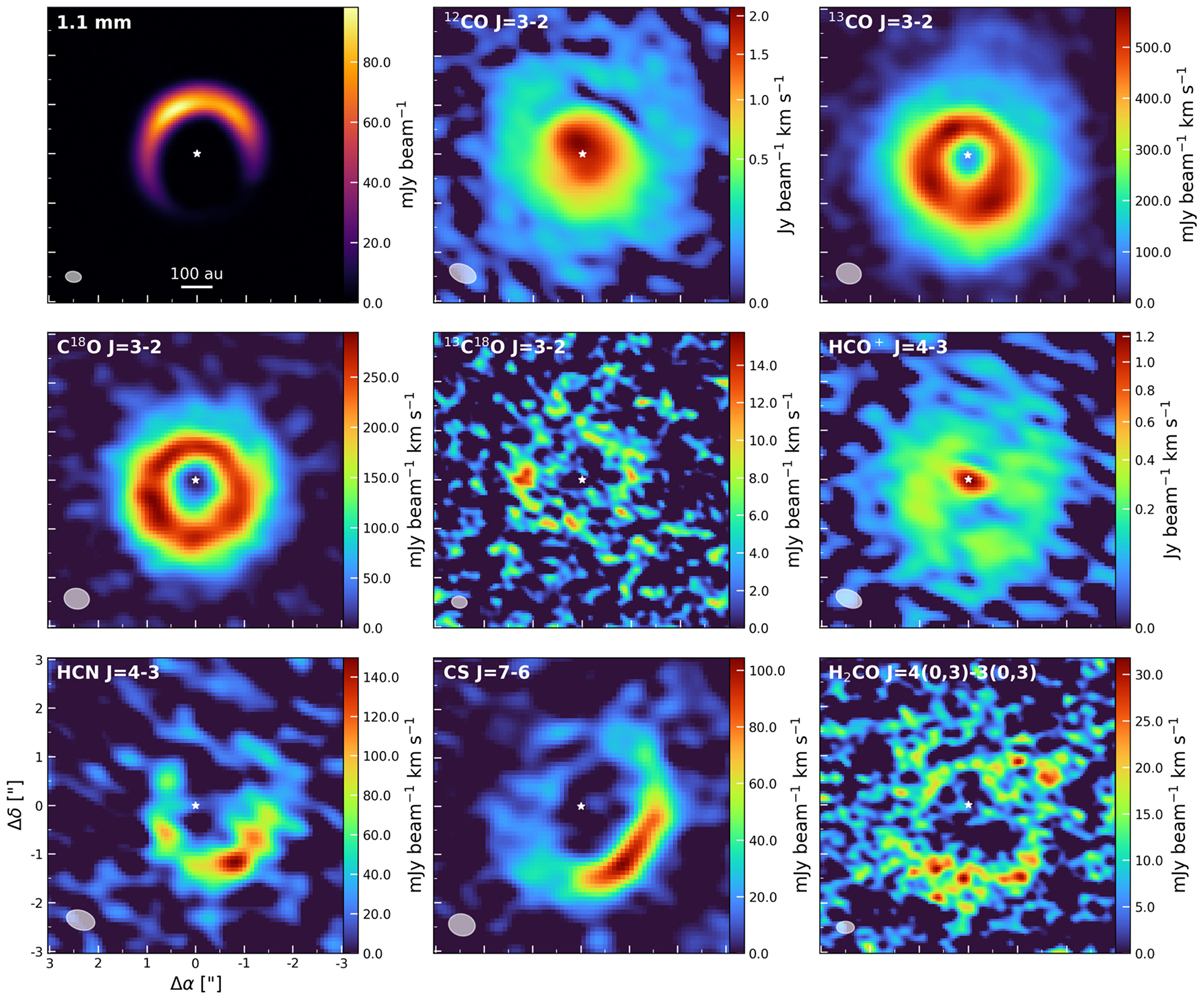
Moment-zero maps of the continuum (upper left) and the majority of the detected molecules. The beams are indicated in the lower left and the white star in the centre shows the inferred location of the host star based on the position of the inner disk. The 12CO and HCO+ colour maps are displayed using a power-law scaling with power 0.5.
Current usage metrics show cumulative count of Article Views (full-text article views including HTML views, PDF and ePub downloads, according to the available data) and Abstracts Views on Vision4Press platform.
Data correspond to usage on the plateform after 2015. The current usage metrics is available 48-96 hours after online publication and is updated daily on week days.
Initial download of the metrics may take a while.