Fig. 5
Download original image
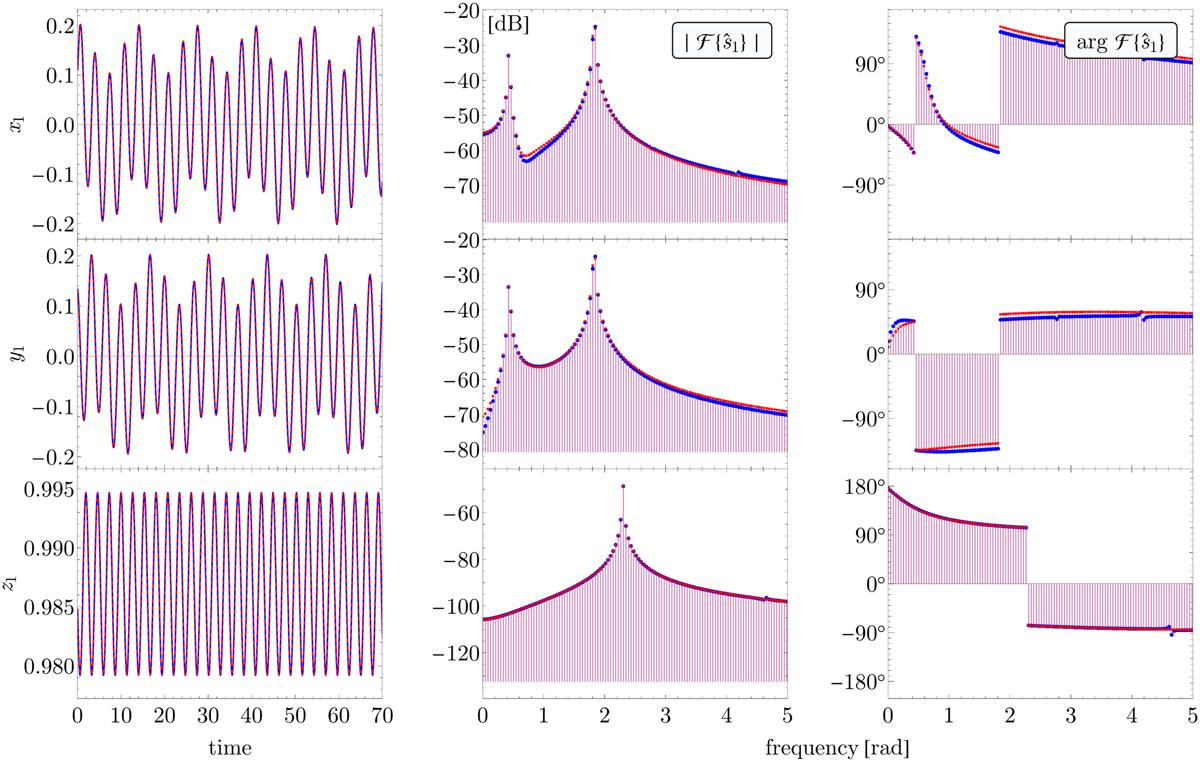
Comparison between the analytical precession model (blue) and numerical integration (red), close to stable equilibrium. On the leftmost column: the components of the spin of the primary, in the time domain. The corresponding Discrete Fourier Transform ℱ{ŝ1} is given in absolute value (power spectrum in decibels, middle column), and in complex argument (rightmost column). The time and frequency axes are expressed in the re-scaled dimensionless units.
Current usage metrics show cumulative count of Article Views (full-text article views including HTML views, PDF and ePub downloads, according to the available data) and Abstracts Views on Vision4Press platform.
Data correspond to usage on the plateform after 2015. The current usage metrics is available 48-96 hours after online publication and is updated daily on week days.
Initial download of the metrics may take a while.