Fig. 4
Download original image
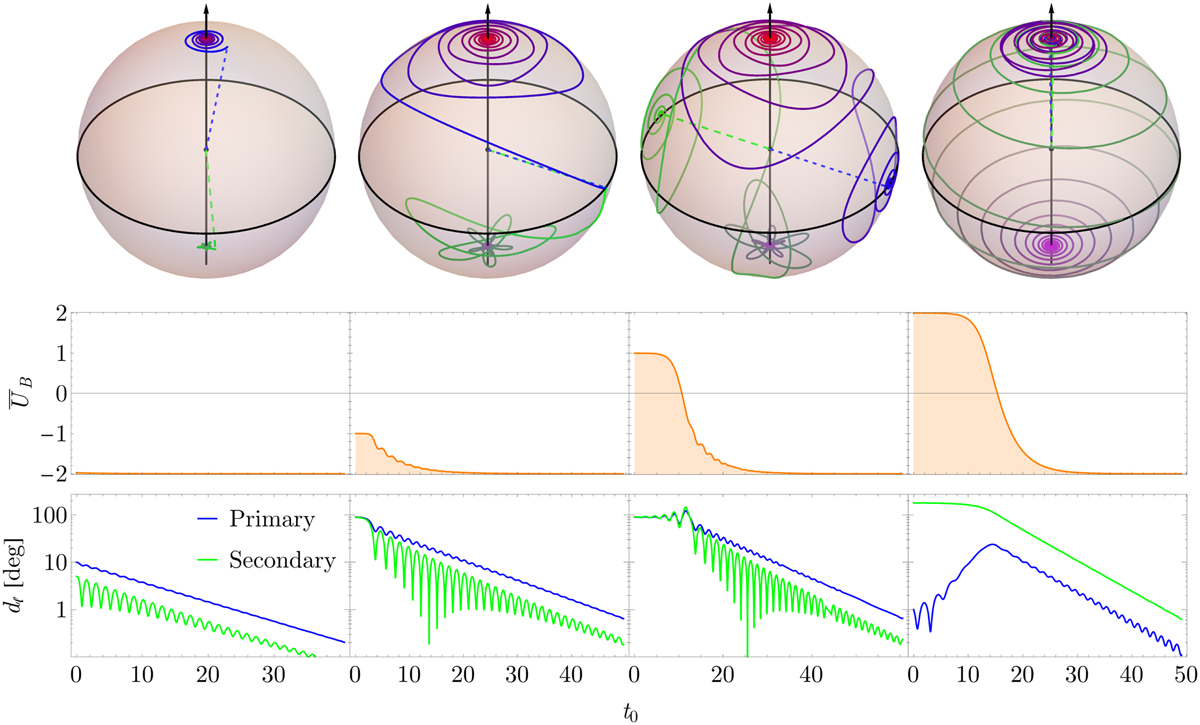
Evolution of the binary system in a secular timescale with dissipation introduced. Each column corresponds to a given initial condition from Table 2, chosen in a neighbourhood of an equilibrium point. On the top row: the trajectory of each spin axis ŝℓ is plotted against the unit sphere, in blue for the primary and green for the secondary. Colours are interpolated towards red from initial time to final time of convergence. Initial conditions for the spin axes are portrayed as dashed lines from the origin to ŝℓ (0). The orbital plane is represented in a darker shade with black contours, and the axis êz as a vertical black arrow. On the middle row: the secular magnetic interaction energy. On the bottom row: the angular distance of each spin axis with respect to the stable equilibrium point (êz, − êz).
Current usage metrics show cumulative count of Article Views (full-text article views including HTML views, PDF and ePub downloads, according to the available data) and Abstracts Views on Vision4Press platform.
Data correspond to usage on the plateform after 2015. The current usage metrics is available 48-96 hours after online publication and is updated daily on week days.
Initial download of the metrics may take a while.