| Issue |
A&A
Volume 675, July 2023
|
|
|---|---|---|
| Article Number | L6 | |
| Number of page(s) | 7 | |
| Section | Letters to the Editor | |
| DOI | https://doi.org/10.1051/0004-6361/202244965 | |
| Published online | 06 July 2023 | |
Letter to the Editor
Polarised radio pulsations from a new T-dwarf binary
1
ASTRON, Netherlands Institute for Radio Astronomy, Oude Hoogeveensedijk 4, 7991 PD Dwingeloo, The Netherlands
e-mail: vedantham@astron.nl
2
Kapteyn Astronomical Institute, University of Groningen, PO Box 72 97200 AB Groningen, The Netherlands
3
Institute for Astronomy, University of Edinburgh, Royal Observatory, Blackford Hill, Edinburgh EH9 3HJ, UK
4
The University of Texas at Austin, Department of Astronomy, 2515 Speedway, C1400, Austin, TX 78712, USA
5
Leiden Observatory, Leiden University, PO Box 9513 2300 RA Leiden, The Netherlands
6
Institute for Astronomy, University of Hawaii, 2680, Woodlawn Drive, Honolulu, HI 96822, USA
7
LESIA, CNRS – Observatoire de Paris, PSL, 92190 Meudon, France
Received:
13
September
2022
Accepted:
5
December
2022
Brown dwarfs display Jupiter-like auroral phenomena such as magnetospheric Hα emission and coherent radio emission. Coherent radio emission is a probe of magnetospheric acceleration mechanisms and it provides a direct measurement of the magnetic field strength at the emitter’s location, both of which are difficult to access by other means. Observations of the coldest brown dwarfs (spectral types T and Y) are particularly interesting as their magnetospheric phenomena may be very similar to those in gas-giant exoplanets. Here we present 144 MHz radio and infrared adaptive optics observations of the brown dwarf WISEP J101905.63+652954.2 made using the Low Frequency Array (LOFAR) and Keck telescopes, respectively. The radio data show pulsed, highly circularly polarised emission which yields a rotation rate of 0.32 ± 0.03 h−1. The infrared imaging reveals the source to be a binary with a projected separation of 423.0 ± 1.6 mas between components of spectral type T5.5 ± 0.5 and T7.0 ± 0.5. With a simple ‘toy model’, we show that the radio emission can, in principle, be powered by the interaction between the two dwarfs with a mass-loss rate of at least 25 times the Jovian value. WISEP J101905.63+652954.2 is interesting because it is the first pulsed methane dwarf detected in a low radio-frequency search. Unlike previous gigahertz-frequency searches that were only sensitive to objects with kiloGauss fields, our low-frequency search is sensitive to surface magnetic fields of ≈50 G and above which might reveal the coldest radio-loud objects down to planetary mass scales.
Key words: brown dwarfs / stars: magnetic field / binaries: general
© The Authors 2023
 Open Access article, published by EDP Sciences, under the terms of the Creative Commons Attribution License (https://creativecommons.org/licenses/by/4.0), which permits unrestricted use, distribution, and reproduction in any medium, provided the original work is properly cited.
This article is published in open access under the Subscribe to Open model. Subscribe to A&A to support open access publication.
1. Introduction
High energy charges around brown dwarfs are expected to be created by auroral (or magnetospheric) processes akin to that seen on gas-giant planets, as opposed to coronal and chromospheric acceleration expected on stars (Nichols et al. 2012; Williams 2018; Turnpenney et al. 2017). This paradigm has been established based on highly circularly polarised and rotationally modulated radio pulses as well as Hα emission observed on brown dwarfs (Hallinan et al. 2007, 2008, 2015; Route & Wolszczan 2012, 2016a; Williams et al. 2017). The radio emission is of particular interest because it is expected to occur at the local cyclotron frequency, which, in the non-relativistic limit, only depends on the ambient magnetic field strength (Melrose & Dulk 1982). Because Zeeman splitting observations become very challenging in such cold objects as brown dwarfs due to the lack of non-broadened spectral lines, radio observations may be the only viable technique to measure their magnetic field strengths and topologies directly. In addition, unlike rocky planets, gas giants and brown dwarfs have predictable and relatively simple internal structures at depths where their magnetic field is expected to be generated (Chabrier & Baraffe 2000). This makes them ideal targets to test dynamo scaling laws (e.g. Christensen et al. 2009) that are likely applicable even in the exoplanet regime.
Despite concerted searches, radio detections of the coldest brown dwarfs are rare. The coldest, spectral type Y brown dwarfs have not been detected in the radio (Kao et al. 2019). At the warmer spectral type T, four brown dwarfs have been detected in dedicated surveys at radio frequencies of 5 GHz and above (Route & Wolszczan 2012, 2016a,b; Kao et al. 2016, 2018). Recently, we reported the first direct discovery of a brown dwarf made by virtue of its radio emission (Vedantham et al. 2020) using the Low Frequency Array (LOFAR) radio telescope (van Haarlem et al. 2013) at 144 MHz. Here we report our second discovery also made with LOFAR. WISEP J101905.63+652954.2 was originally discovered by Kirkpatrick et al. (2011) in Wide-field Infrared Survey Explorer (WISE) data (Wright et al. 2010) and, using spectroscopic data, it was assigned optical and near-infrared spectral types of T7 and T6, respectively.
Cold brown dwarfs share their radio phenomenology with Jupiter. The radio emission consists of two components: a quasi-quiescent component that is unpolarised or weakly polarised and a highly circularly polarised pulsed component that repeats at the rotation rate (Williams 2018; Antonova et al. 2013; Hallinan et al. 2008; Berger 2006). However, the radio energetics of the detected brown dwarfs is orders of magnitude larger than that seen in Jupiter. This, combined with a lack of detection of UV or H3+ from brown dwarfs (Saur et al. 2021; Gibbs & Fitzgerald 2022), suggests that the Jovian auroral energetics cannot be simply scaled to brown dwarfs. In any case, magnetic field lower limits derived from the pulsed component in three of the detected T dwarfs have been over a factor of three larger than the predictions of leading dynamo scaling laws that can successfully predict the field strength of some Solar System planets and low mass stars (Kao et al. 2018). This suggests that the model is inadequate, or it is also possible that by virtue of observing at high frequencies, the previous radio surveys were only sensitive to objects with anomalously large magnetic fields. For instance, Christensen et al. (2009) predicted a field strength of 103 G for a 50 MJup brown dwarf with an age of 109 yr and a surface temperature of 1500 K (late-L dwarf). The corresponding peak cyclotron frequency in its magnetosphere is about 2.8 GHz, which makes such an object undetectable in a 5 GHz survey even if it were ‘typical’ of the predicted population. The 144 MHz LOFAR data can detect objects with surface field strengths as low as 50 G. Therefore, the LOFAR-detected objects such as WISEP J101905.63+652954.2 are beginning to provide a more complete sample to critically test dynamo scaling laws over a larger range in magnetic field strengths.
This Letter is organised as follows: Sect. 2 presents details of the radio and infrared observations and the analysis of the radio light curve. In Sect. 3 we discuss the possible mechanisms driving the radio emission, and present our conclusions and outlook in Sect. 4.
2. Observations
2.1. LOFAR 144 MHz observations
WISEP J101905.63+652954.2 was discovered as part of our ongoing search (e.g. Callingham et al. 2021) for stars, brown dwarfs, and exoplanets using data from the LOFAR Two Metre Sky Survey (LoTSS; Shimwell et al. 2022). Our methodology has typically involved searching for circularly polarised sources in deep 8 h exposure LoTSS images. This is how we found Elegast, the first radio-selected brown dwarf (Vedantham et al. 2020). Because brown dwarf auroral emission is typically pulsed at the rotation period, we have since implemented a search algorithm to construct Stokes-V light curves on various time-bin widths to search for on-off and periodic pulsations from known brown dwarfs. Although we plan to conduct an untargeted search for such pulses over the northern sky, we first validated our approach by a targeted search of ten known T- and Y-type brown dwarfs, which led to the discovery of Stokes-V radio pulsations from WISEP J101905.63+652954.2.
Our current pipeline takes in the standard calibrated visibilities from the LoTSS survey. We first subtracted the LoTSS-detected sources from the visibilities using their direction-dependent gains while retaining on-axis sources in the direction of the target for an additional round of self-calibration as described in van Weeren et al. (2021). We then modelled and subtracted these sources using their clean components from wsclean. We then imaged the target fields using wsclean (Offringa et al. 2014) at a cadence of 4 min and extracted the light curves from these images. The light curve of WISEP J101905.63+652954.2 shows a statistically significant burst (Fig. 1). The on and flanking off-burst snapshot images are also shown. The figure also shows the light curve binned to a resolution of 16 min in red, which reveals a hint of periodicity at around a 3 h period.
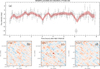 |
Fig. 1. Discovery of radio emission from WISEP J101905.63+652954.2. Panel a: Stokes-V radio light curve of WISEP J101905.63+652954.2 with a bin width of 4 min (black points with ±1σ errorbars) and 16 min (red curve with shaded ±1σ uncertainty). The point marked with the black square is a significant detection with a flux density of −4.1 (7) mJy whose Stokes-V image is shown in panel c. Panels b and d: similar 4 min exposure images bracketing the integration shown in panel c. |
Polarised radio emission from planets and brown dwarfs is expected to have a periodic signature at the rotation period of the object due to beaming (akin to a light house). To ascertain the period signature in the light curve, we computed the Lomb-Scargle periodogram of the light curve using the astropy (Astropy Collaboration 2013, 2018) implementation (see Fig. 2). To compute the significance of the periodogram peaks, we computed the false alarm rate based on the bootstrap method described in VanderPlas (2018). We detect a dominant peak at a frequency of 0.324 h−1 with a false alarm rate of under 3%. We computed an uncertainty in the peak’s location of 0.033 h−1 using the method prescribed in Eq. (52) of VanderPlas (2018).
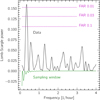 |
Fig. 2. Lomb-Scargle periodogram of the radio light curve from Fig. 1. The dominant peak with a false alarm rate of under 3% is at 0.324 ± 0.033 h−1. |
2.2. Keck/NIRC2 LGS AO
We observed WISEP J101905.63+652954.2 on 2015 January 15 UT and 2022 January 24 UT with the facility imager called NIRC2 at the Keck II telescope in concert with the laser guide star (LGS) adaptive optics (AO) system (van Dam et al. 2006; Wizinowich et al. 2006). For tip-tilt correction, we used the star USNO-B1.0 1554–0140735, which is 23″ away from the target and provided flux to the tip-tilt sensor equivalent to R = 18.2 mag. The wavefront sensor monitoring the LGS measured a flux equivalent to a V = 10.2 mag star in 2015 and V = 8.5 mag in 2022, thanks to the intervening LGS upgrade (Chin et al. 2016). We obtained images with standard Maunakea Observatories’ filters in the J and H bands (Tokunaga et al. 2002) as well as CH4s, a medium-bandwidth filter centred on the H-band flux peak of T dwarfs. For each filter, we obtained between four and six dithered 180-s images in 2015 and 60-s images in 2022, while keeping the LGS fixed to the centre of NIRC2’s narrow camera ( pixel−1) field of view (10″ × 10″). In 2015, the AO correction deteriorated significantly as we collected data, and the quality of our H-band data set was too poor to be included in our analysis.
We reduced our data using the same custom scripts as in our previous work (e.g. Liu et al. 2008; Dupuy et al. 2015), and examples of individual exposures are shown in Fig. 3. We measured the separation, position angle (PA), and magnitude difference in individual exposures using three-component, two-dimensional Gaussians, and we computed the means and standard deviations of measurements from individual exposures as the final measurements and their uncertainties. For our 2015 data, we used the astrometric calibration of Yelda et al. (2010) to correct for non-linear distortion, the orientation of NIRC2 (by subtracting  ), and the pixel scale (9.952 ± 0.002 mas pixel−1). Likewise, for our 2022 data, we used the calibration of Service et al. (2016). The resulting binary parameters are given in Table 1. Our relative astrometry is consistent within the errors at each epoch, and the repeated observations in J and CH4s filters show no significant change in flux ratio.
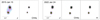 |
Fig. 3. Contour plots of one typical individual exposure for each filter in which we obtained infrared data. Contours are drawn in logarithmic intervals from the peak flux down to 10% of the peak flux in each image. The images are all 1 |


Keck LGS AO relative astrometry and photometry of WISEP J101905.63+652954.2.
To compute the final relative astrometry at each epoch, we took the weighted average of our relative astrometry measurements and added a systematic error of 1.5 mas to account for the uncertainty in the distortion corrections of NIRC2. This gives separations of 423.0 ± 1.6 mas and 468.2 ± 1.6 mas and PAs of  and
and  in 2015 and 2022, respectively. The observed motion of ≈7 mas yr−1 is much lower than the proper motion of the system (150.6 ± 1.1 mas yr−1) measured by Kirkpatrick et al. (2019), so we conclude that the companion shares a common proper motion with the primary and that it is physically bound.
Our Keck images also show a fainter point source ≈2″ away from WISEP J101905.63+652954.2 at a position angle of ≈200°. We identified this source in the Pan-STARRS1 3π survey catalogue (Chambers et al. 2016) as PSO J154.7727+65.4978. It is visible in stacked rizyP1 images and appears brightest in zP1. Its (z − y)P1 = 0.41 ± 0.13 mag colour (using stacked photometry) is far too blue to be a fainter, later-T or Y dwarf (Best et al. 2018), so we conclude this is a background star or galaxy. Although this source is only about 2″ from the nominal position of the radio detection, it is almost certainly not the source of the observed radio emission. The high circular polarisation in the radio band is inconsistent with an extragalactic origin, so we only need to consider the Galactic stellar hypothesis. The absolute radio astrometry has a Gaussian-equivalent standard deviation of  (Shimwell et al. 2022), yielding a 4σ discrepancy in position. The Pan-STARRS1 z − y colour suggests that the source is a mid M dwarf whose zP1 = 21.06 ± 0.06 mag places it at a photometric distance of over 300 pc. This is well beyond the sensitivity horizon of LOFAR for M dwarfs’ cyclotron maser emission (Callingham et al. 2021). Finally, the rotation rate implied by the radio observations of 0.32 h−1 is unusually large for a mid M dwarf (Popinchalk et al. 2021). For these reasons, we reject the association between the radio source and PSO J154.7727+65.4978.
In order to compute CH4s − H colours for the two components of WISEP J101905.63+652954.2 from Keck LGS AO imaging, we used its infrared spectrum from 2010 May 27 UT presented by Kirkpatrick et al. (2011) to measure integrated-light colours of CH4s − H = − 0.42 mag and J − H = −0.34 mag. Combined with the 2MASS-survey measurement of J = 16.589 ± 0.055 mag, these colours give integrated-light photometry of H = 16.93 ± 0.06 mag and CH4s = 16.51 ± 0.06 mag. Combined with our measured magnitude differences in CH4s and H, we find colours of CH4s − H = −0.382 ± 0.013 mag and −0.481 ± 0.020 mag for the primary and secondary, respectively. Using the spectral type-colour relation detailed by Liu et al. (2008), we determined methane-photometry-based spectral types of T5.5 ± 0.5 and T7.0 ± 0.5.
3. Discussion
3.1. Mass and magnetic field estimates
We computed the combined-light bolometric luminosity of WISEP J101905.63+652954.2 by the direct integration of its unresolved optical to mid-infrared (MIR) spectral energy distribution (SED). The assembled SED consists of available Pan-STARRS-1 (PS1; Chambers et al. 2016) optical photometry (z, y), the near-infrared (NIR) IRTF/SpeX prism spectrum, NIR photometry from 2MASS (Cutri et al. 2003), MKO filter-set photometry (Best et al. 2021), and MIR photometry from the CatWISE catalogue (W1 and W2 bands; Eisenhardt et al. 2020; Marocco et al. 2021), the AllWISE catalogue (W3 and W4 bands; Cutri et al. 2013), and Spitzer/IRAC Channels 1 and 2 (Fazio et al. 2004). First, we flux-calibrated the SpeX spectrum using the weighted average of scale factors derived from PS1 y, 2MASS JHKs, and MKO JHK photometry, assuming a systematic noise floor of 0.01 mag for all the filters. We then integrated the flux-calibrated SpeX spectrum to determine the NIR contribution to the bolometric flux, accounting for the uncertainties in the spectral data points and the flux calibration procedures. We determined the optical and MIR contributions to the bolometric flux by simultaneously fitting model atmospheres (ATMO 2020; Phillips et al. 2020) to the PS1 and WISE photometry (computing synthetic photometry from the models) and the SpeX spectrum (with the models degraded to the non-linear spectral resolution of the 0 5 slit). We found the best-fitting ATMO model had Teff = 1000 K and log g = 5.5 dex. Our final bolometric flux was found by adding the NIR contribution to the integration of the model outside the wavelength range of the SpeX spectrum. The uncertainty in the optical+MIR contribution was obtained from the standard deviation of the corresponding measurements derived using the three model spectra adjacent in Teff and log g to the best-fitting model. Using WISEPA J101905.63+652954.2’s parallax of 42.9 ± 1.8 mas, we calculated its bolometric luminosity log(Lbol/L⊙) = − 4.994 ± 0.063 dex.
To determine the mass of each component in the binary system, we combined their luminosities and ages with the Saumon & Marley (2008, SM08) hybrid evolutionary model. Each component’s luminosity was estimated using the bolometric luminosity versus spectral type relations from Filippazzo et al. (2015). We find that ≈70% of the luminosity is contributed by the T5.5 dwarf and ≈30% is contributed by the T7 dwarf. For each object, we adopted the field-age distribution from (DL17, Dupuy & Liu 2017). For our mass calculations, we used the Bayesian rejection sampling technique described in Dupuy & Liu (2017). First, we drew 106 random (luminosity and age) samples from a uniform distribution spanning the bolometric luminosity range of the evolutionary model grid and the intersection of the DL17 age range and the evolutionary model grid age range. Second, we computed the probability of each sample based on the χ2 of the drawn luminosity with respect to the measured value and the likelihood of drawing the sample’s age from the DL17 distribution. Third, we randomly drew 106 uniform variates (u) distributed in the range from 0 to 1 and rejected any samples where p < u. The fourth and final step was to interpolate the evolutionary models linearly (in logarithmic space) at each accepted luminosity-age point to calculate the corresponding mass. We find a mass of 41 ± 18 MJup for the T5.5 component and 32 ± 16 MJup for the T7 component.
Armed with the mass and luminosity values, we can estimate the magnetic fields of the two objects using so-called dynamo scaling laws. We employed the ‘saturated dynamo’ scaling law proposed by Christensen et al. (2009), which relates the magnetic field to the heat flux and mean density of the brown dwarf. We used the law in the form given by Reiners & Christensen (2010, their Eq. (1)). We also used their correction to estimate the surface dipolar field from the field at the top of the dynamo as predicted by the scaling law (Reiners & Christensen 2010, their Eq. (2)). Although the objects’ luminosities have small errors, the mass estimates and the normalising constant in the scaling law have large fractional errors. To properly incorporate these errors into the predicted magnetic field strength, we ran a Monte-Carlo simulation where we drew the normalising constant from a uniform distribution (Reiners et al. 2009, their Eq. (1)), and the mass from a normal distribution. In each step of the Monte Carlo run, we interpolated the evolutionary models of Baraffe et al. (2003) to find the relationship between mass and field strength for the measured luminosity (i.e. for different ages). The resulting distribution of polar dipole field strengths for the T5.5 and T7 objects had a mean and standard deviation of 660 ± 300 G and 460 ± 210 G, respectively.
The observed cyclotron maser emission itself places a lower limit on the polar surface magnetic field strength of 51.4 G (cyclotron frequency at the mid-point of the LOFAR data’s radio band). While this is consistent with the field estimates made above, higher frequency observations are necessary to critically test the dynamo scaling law. In what follows, we leave the polar surface field as a variable while normalising our equations at B = 1 kG.
3.2. Energetics
WISEP J101905.63+652954.2 has not yet been detected at the gigahertz frequencies where quiescent incoherent synchrotron emission is typically observed. A non-detection in the Jansky Very Large Array Sky Survey (Lacy et al. 2020) quick-look images yields a 3σ upper limit of 0.34 mJy in the 2−4 GHz band. Although incoherent radio emission has been used widely as a proxy for the energetics of magnetospheric and coronal emitters (Pineda et al. 2017; Leto et al. 2021; Benz & Guedel 1994), here we use the pulsed radio emission to calculate the energetics of the auroral electrons. We posit that the radio pulsations are due to beaming combined with rotation and that the beam solid angle of the radio emission is 1.6 sr, which is identical to that of Jupiter’s auroral radio emission due to its magnetosphere–ionosphere coupling (Zarka et al. 2004). The radio spectral luminosity for a pulse flux density of 2 mJy (see Fig. 1) and a measured distance of 23.3 pc (Kirkpatrick et al. 2019) is then (2 mJy)×(23.3 pc)2 × (1.6 sr)≈1.7 × 10¹⁴ erg s−1 Hz−1. If we further assume that the total bandwidth of the radio emission is equal to the cyclotron frequency at the surface of the object, then the auroral radio power is 4.6 × 10²³ (B/kG) erg s−1. Assuming a 1% efficiency in the conversion of the available auroral power to radio waves (Zarka 2007; Lamy et al. 2011), we obtain an auroral power of 4.6 × 1025 (B/kG) erg s−1. For comparison, the auroral power output of Jupiter is ∼1020 erg s−1 (Bhardwaj & Gladstone 2000), and Turnpenney et al. (2017) predict auroral powers of up to 1026.5 erg s−1 (assuming the same 1% radio efficiency) for the Jovian magnetosphere-ionosphere paradigm applied to ultra-cool dwarfs.
3.3. Potential binary interaction powering the radio emission
A magnetic interaction between the two objects can accelerate charges, which eventually emit cyclotron maser radio emission, as seen in the Jupiter-Io system (Goldreich & Lynden-Bell 1969; Neubauer 1998; Zarka 1998). The projected separation of the two brown dwarfs in WISEP J101905.63+652954.2 is 9.9 ± 0.4 au, given their parallactic distance of 23.3 ± 1.0 pc (Kirkpatrick et al. 2019). We explored the full range of orbital parameters for the binary by fitting the two epochs of relative astrometry from Sect. 2.2 with the ORVARA orbit analysis tool (Brandt et al. 2021). We used a prior on the total mass of 0.071 ± 0.033 M⊙ based on our mass estimates from Sect. 3.1. As expected, the orbital parameters are poorly constrained, but we can place 3σ limits on the semi-major axis (> 5.2 au), period (> 30 yr), inclination (< 86°), and eccentricity (< 0.96). The posterior distributions have medians and 1σ confidence intervals of  au,
au,  yr, and
  deg, but we caution that these are highly influenced by the priors. (The eccentricity posterior is almost unchanged from the uniform prior below the upper limit we quote.)
Based on the radio rotation rate of the emitter, its light cylinder is at a radial distance of about 3.4 au. Therefore, even if the magnetospheres are not loaded with plasma (i.e. under force-free electrodynamics), a direct magnetic interaction between the two dipolar magnetospheres is not possible and we must consider interception by one brown dwarf of the Poynting flux radiated by the other. The Poynting flux radiated by an oblique rotator (akin to a Pulsar’s dipole emission) is of the order of  (Condon & Ransom 2016), where B0 is the surface magnetic field, Ω is the angular rotation rate, and R0 is the object’s radius. For characteristic values of B0 = 103 G, R0 = 7 × 109 cm, and Ω = 5.6 × 10⁻⁴ s−1, we get L ∼ 1020 erg s−1 which falls well short of the value necessary to power the radio emission.
Next, we consider a scenario where the magnetospheres are loaded by plasma and drive a feeble wind. For simplicity, we assume that the two magnetospheres and their co-rotation rates are similar. Due to the fast rotation, the balance between the centrifugal force of the co-rotating plasma and magnetic pressure must determine the structure of the magnetosphere in this case (i.e. the gravitational force can be safely neglected) and the eventual Poynting flux. The centrifugal pressure felt by the plasma is Fc = ρΩ2R2/2, where R is the radial distance, Ω is the angular rotation rate, and ρ = ρ(R) is the plasma density at radius R. The magnetic pressure for a dipole at distance R is  , where R0 is the object’s radius and B0 is the surface magnetic field strength. In our simple ‘toy model’, at low radii, FB dominates enforcing co-rotation with a dipolar field. This breaks at a critical radius when FB = FC. Beyond this radius, we assume that the field lines open up into a Parker-spiral-type configuration. We note that FB = FC is equivalent to saying that the co-rotation speed equals the local Alfvén speed. The critical radius is therefore the so-called Alfvén point:
In the open field zone, the azimuthal field dominates, falling off with distance, R as R−1. We therefore assume B(R) = B(rA)(R/rA)−1 where B(rA) = B0(rA/R0)−3. The brown dwarf wind beyond rA is assumed to have a radial flow speed, vr, equal to the co-rotation speed at rA as suggested for the Jovian case by Hill et al. (1974). With these assumptions, the Poynting luminosity can be readily computed as S = (B2/8π)×vr × (4πR2) at any closed surface with a radius of R > rA. The mass-loss rate is given by  . For parameters applicable to WISEP J101905.63+652954.2 of R0 = 7 × 109 cm, B0 = 103 G, Ω = 5.6 × 10⁻⁴ s−1, we find that the necessary Poynting luminosity of ≈1025.5 erg s−1 can be achieved with a mass-loss rate of ≈25 tonnes per second. The corresponding Alfvén point is at rA = 188 R0. If instead we assume B0 = 100 G, then we get the necessary Poynting flux for Ṁ ≈ 550 tonnes per second and rA = 40 R0. For comparison, Io’s volcanism is the principal source of Jovian magnetospheric plasma whose loss rate is about 1 tonne per second. In any case, a significant fraction of the emitted Poynting flux must be intercepted by the magnetosphere of the companion for conversion of this Poynting flux into radiation emission due to a binary interaction. We therefore conclude that while energetically feasible in principle, further work on the precise details of the wind–wind interaction and the source of mass loss must be worked out to ascertain whether this interaction could have powered the observed radio emission from WISEP J101905.63+652954.2.
3.4. Auroral signatures
Regardless of the veracity of the interaction-powered emission scenario, we shall assume that at the emitter in WISEP J101905.63+652954.2, an auroral mechanism similar to that seen on Jupiter is at play. Such aurorae have also been suggested as the radio emission mechanism in other brown dwarfs and ultracool dwarfs (e.g. Hallinan et al. 2015; Turnpenney et al. 2017). Jupiter’s aurorae emit comparable amounts of power in the radio and Hα line (Bhardwaj & Gladstone 2000; Zarka 1998). Assuming the same for WISEP J101905.63+652954.2, we would anticipate an Hα luminosity of 4.6 × 10²³ (B/kG) erg s−1. Assuming a characteristic line width of 6 Å (Pineda et al. 2016), the expected Hα flux density is ≈7 × 10⁻¹⁸ (B/kG) erg s−1 cm−2 Å−1. Based on the optical spectrum or WISEP J101905.63+652954.2 presented by Kirkpatrick et al. (2011), we derived a 2σ upper limit on the Hα luminosity of 2.8 × 10⁻¹⁸ erg s−1 cm−2 Å−1. This suggests that the surface magnetic field of WISEP J101905.63+652954.2 is B ≲ 103 G, which is broadly consistent with our magnetic field estimate from Sect. 3.1. Nevertheless, we caution that it is not possible to make definite statements as to the magnetic field strength because the radio and Hα efficiencies as well as the radio beam solid angle can only be trusted to within an order of magnitude. In conclusion, we find that the available data are consistent with a Jupiter-like auroral process driving the radio emission in a magnetosphere with a surface strength of the order of a kiloGauss.
4. Conclusions and outlook
Magnetospheric emissions from the coldest brown dwarfs provide a rare glimpse into magnetism in the planetary mass regime outside the Solar System. Here we have presented our second detection of a methane-bearing, T-type brown dwarf–WISEP J101905.63+652954.2–with LOFAR at 144 MHz. The radio emission is pulsed and periodic, from which we derived a rotation rate of 0.32 ± 0.03 h−1 (1σ bounds). We have also presented infrared AO observations of WISEP J101905.63+652954.2 that show it to be a T-dwarf binary with a separation of 9.9 ± 0.4 au and spectral types T5.5 ± 0.5 and T7.0 ± 0.5, making it the first T-dwarf binary to be detected in the radio band. We considered binarity as the cause of the radio emission. We find that while energetically feasible for mass-loss rates of ≳25 tonnes per second, precise details of the interaction region must be studied before a binary interaction can be posited as the probable cause of the emission. In this regard, it is interesting to note that Kao & Sebastian Pineda (2022) have suggested (based on detection rates and luminosities) that binary ultracool dwarfs may be more radio-loud than their single counterparts. If this is true, then a radio selection as we have done here might reveal a population of close binary brown dwarfs upon infrared follow-up observations, similar to WISEP J101905.63+652954.2.
WISEP J101905.63+652954.2 is the first brown dwarf detected at 144 MHz with the canonical periodic pulsed emission profile similar to that seen in the centimetre-wave band and on Jupiter at ν ≲ 40 MHz. Three previously detected T dwarfs in the centimetre-wave band have, unexpectedly, shown pulses up to 10 and/or 15 GHz with no sign of a distinct high-frequency cutoff (Kao et al. 2018). This suggests magnetic field strengths well in excess of that anticipated by some dynamo scaling laws, suggesting that the laws need to be revised. However, it is also possible that, by virtue of a survey bias, the high frequency surveys have preferentially detected a small population of T dwarfs that have anomalously high field strengths possibly in smaller magnetic loops rather than the large-scale field predictions made from dynamo models. Because WISEP J101905.63+652954.2 was selected from a 144 MHz survey that does not have this selection bias, it will be very interesting to see if its spectral cutoff also occurs at unexpectedly high frequencies.
We end by noting that WISEP J101905.63+652954.2 is the second detected, and first pulsed, brown dwarf system found in the ongoing LoTSS. As demonstrated by Vedantham et al. (2020), because the radio emission is non-thermal in origin, radio surveys may be able to discover a population of the coldest brown dwarfs that are too faint to be found in canonical infrared surveys. The pulsed emission from WISEP J101905.63+652954.2 therefore motivates an all-sky, untargeted search for pulsed, circularly polarised emitters in LoTTS survey data.
Acknowledgments
We thank Dr. Davy Kirkpatrick for making the Keck optical spectrum of WISEP J101905.63+652954.2 available to us in machine-readable format. H.K.V. acknowledges funding from the Dutch Research Council (NWO) for the project e-MAPS (project number Vi.Vidi.203.093) under the NWO talent scheme VIDI. J.R.C. thanks NWO for support via the Talent Programme Veni grant. LOFAR is the Low Frequency Array designed and constructed by ASTRON. It has observing, data processing, and data storage facilities in several countries, that are owned by various parties (each with their own funding sources), and that are collectively operated by the ILT foundation under a joint scientific policy. The ILT resources have benefitted from the following recent major funding sources: CNRS-INSU, Observatoire de Paris and Université d’Orléans, France; BMBF, MIWF-NRW, MPG, Germany; Science Foundation Ireland (SFI), Department of Business, Enterprise and Innovation (DBEI), Ireland; NWO, The Netherlands; The Science and Technology Facilities Council, UK. This research made use of the Dutch national e-infrastructure with the support of the SURF Cooperative (e-infra 180169) and the LOFAR e-infra group. The Jülich LOFAR Long Term Archive and the German LOFAR network are both coordinated and operated by the Jülich Supercomputing Centre (JSC), and computing resources on the supercomputer JUWELS at JSC were provided by the Gauss Centre for Supercomputing e.V. (grant CHTB00) through the John von Neumann Institute for Computing (NIC). This research made use of the University of Hertfordshire high-performance computing facility and the LOFAR-UK computing facility located at the University of Hertfordshire and supported by STFC [ST/P000096/1], and of the Italian LOFAR IT computing infrastructure supported and operated by INAF, and by the Physics Department of Turin University (under an agreement with Consorzio Interuniversitario per la Fisica Spaziale) at the C3S Supercomputing Centre, Italy. Some of The data presented herein were obtained at the W. M. Keck Observatory, which is operated as a scientific partnership among the California Institute of Technology, the University of California and the National Aeronautics and Space Administration. The Observatory was made possible by the generous financial support of the W. M. Keck Foundation. The authors wish to recognise and acknowledge the very significant cultural role and reverence that the summit of Maunakea has always had within the indigenous Hawaiian community. We are most fortunate to have the opportunity to conduct observations from this mountain.
References
- Antonova, A., Hallinan, G., Doyle, J. G., et al. 2013, A&A, 549, A131 [NASA ADS] [CrossRef] [EDP Sciences] [Google Scholar]
- Astropy Collaboration (Robitaille, T. P., et al.) 2013, A&A, 558, A33 [NASA ADS] [CrossRef] [EDP Sciences] [Google Scholar]
- Astropy Collaboration (Price-Whelan, A. M., et al.) 2018, AJ, 156, 123 [Google Scholar]
- Baraffe, I., Chabrier, G., Barman, T. S., Allard, F., & Hauschildt, P. H. 2003, A&A, 402, 701 [NASA ADS] [CrossRef] [EDP Sciences] [Google Scholar]
- Benz, A. O., & Guedel, M. 1994, A&A, 285, 621 [NASA ADS] [Google Scholar]
- Berger, E. 2006, ApJ, 648, 629 [NASA ADS] [CrossRef] [Google Scholar]
- Best, W. M. J., Magnier, E. A., Liu, M. C., et al. 2018, ApJS, 234, 1 [Google Scholar]
- Best, W. M. J., Liu, M. C., Magnier, E. A., & Dupuy, T. J. 2021, AJ, 161, 42 [Google Scholar]
- Bhardwaj, A., & Gladstone, G. R. 2000, Rev. Geophys., 38, 295 [CrossRef] [Google Scholar]
- Brandt, T. D., Dupuy, T. J., Li, Y., et al. 2021, AJ, 162, 186 [NASA ADS] [CrossRef] [Google Scholar]
- Callingham, J. R., Vedantham, H. K., Shimwell, T. W., et al. 2021, Nat. Astron., 5, 1233 [NASA ADS] [CrossRef] [Google Scholar]
- Chabrier, G., & Baraffe, I. 2000, ARA&A, 38, 337 [Google Scholar]
- Chambers, K. C., Magnier, E. A., Metcalfe, N., et al. 2016, arXiv e-prints [arXiv:1612.05560] [Google Scholar]
- Chin, J. C. Y., Wizinowich, P., Wetherell, E., et al. 2016, in Adaptive Optics Systems V, eds. E. Marchetti, L. M. Close, & J. P. Véran, SPIE Conf. Ser., 9909, 99090S [NASA ADS] [CrossRef] [Google Scholar]
- Christensen, U. R., Holzwarth, V., & Reiners, A. 2009, Nature, 457, 167 [Google Scholar]
- Condon, J. J., & Ransom, S. M. 2016, Essential Radio Astronomy (Princeton: Princeton University Press) [Google Scholar]
- Cutri, R. M., Skrutskie, M. F., van Dyk, S., et al. 2003, 2MASS All Sky Catalog of Point Sources [Google Scholar]
- Cutri, R. M., Wright, E. L., Conrow, T., et al. 2013, Explanatory Supplement to the AllWISE Data Release Products [Google Scholar]
- Dupuy, T. J., & Liu, M. C. 2017, ApJS, 231, 15 [Google Scholar]
- Dupuy, T. J., Liu, M. C., & Leggett, S. K. 2015, ApJ, 803, 102 [NASA ADS] [CrossRef] [Google Scholar]
- Eisenhardt, P. R. M., Marocco, F., Fowler, J. W., et al. 2020, ApJS, 247, 69 [Google Scholar]
- Fazio, G. G., Hora, J. L., Allen, L. E., et al. 2004, ApJS, 154, 10 [Google Scholar]
- Filippazzo, J. C., Rice, E. L., Faherty, J., et al. 2015, ApJ, 810, 158 [Google Scholar]
- Gibbs, A., & Fitzgerald, M. P. 2022, AJ, 164, 63 [NASA ADS] [CrossRef] [Google Scholar]
- Goldreich, P., & Lynden-Bell, D. 1969, ApJ, 156, 59 [Google Scholar]
- Hallinan, G., Bourke, S., Lane, C., et al. 2007, ApJ, 663, L25 [NASA ADS] [CrossRef] [Google Scholar]
- Hallinan, G., Antonova, A., Doyle, J. G., et al. 2008, ApJ, 684, 644 [Google Scholar]
- Hallinan, G., Littlefair, S. P., Cotter, G., et al. 2015, Nature, 523, 568 [NASA ADS] [CrossRef] [Google Scholar]
- Hill, T. W., Dessler, A. J., & Michel, F. C. 1974, Geophys. Res. Lett., 1, 3 [NASA ADS] [CrossRef] [Google Scholar]
- Kao, M. M., & Sebastian Pineda, J. 2022, ApJ, 932, 21 [NASA ADS] [CrossRef] [Google Scholar]
- Kao, M. M., Hallinan, G., Pineda, J. S., et al. 2016, ApJ, 818, 24 [NASA ADS] [CrossRef] [Google Scholar]
- Kao, M. M., Hallinan, G., Pineda, J. S., Stevenson, D., & Burgasser, A. 2018, ApJS, 237, 25 [NASA ADS] [CrossRef] [Google Scholar]
- Kao, M. M., Hallinan, G., & Pineda, J. S. 2019, MNRAS, 487, 1994 [NASA ADS] [CrossRef] [Google Scholar]
- Kirkpatrick, J. D., Cushing, M. C., Gelino, C. R., et al. 2011, ApJS, 197, 19 [NASA ADS] [CrossRef] [Google Scholar]
- Kirkpatrick, J. D., Martin, E. C., Smart, R. L., et al. 2019, ApJS, 240, 19 [NASA ADS] [CrossRef] [Google Scholar]
- Lacy, M., Baum, S. A., Chandler, C. J., et al. 2020, PASP, 132, 035001 [Google Scholar]
- Lamy, L., Cecconi, B., Zarka, P., et al. 2011, J. Geophys. Res.: Space Phys., 116, A04212 [Google Scholar]
- Leto, P., Trigilio, C., Krtička, J., et al. 2021, MNRAS, 507, 1979 [NASA ADS] [CrossRef] [Google Scholar]
- Liu, M. C., Dupuy, T. J., & Ireland, M. J. 2008, ApJ, 689, 436 [NASA ADS] [CrossRef] [Google Scholar]
- Marocco, F., Eisenhardt, P. R. M., Fowler, J. W., et al. 2021, ApJS, 253, 8 [Google Scholar]
- Melrose, D. B., & Dulk, G. A. 1982, ApJ, 259, 844 [Google Scholar]
- Neubauer, F. M. 1998, J. Geophys. Res., 103, 19843 [NASA ADS] [CrossRef] [Google Scholar]
- Nichols, J. D., Burleigh, M. R., Casewell, S. L., et al. 2012, ApJ, 760, 59 [Google Scholar]
- Offringa, A. R., McKinley, B., Hurley-Walker, N., et al. 2014, MNRAS, 444, 606 [Google Scholar]
- Phillips, M. W., Tremblin, P., Baraffe, I., et al. 2020, A&A, 637, A38 [NASA ADS] [CrossRef] [EDP Sciences] [Google Scholar]
- Pineda, J. S., Hallinan, G., Kirkpatrick, J. D., et al. 2016, ApJ, 826, 73 [NASA ADS] [CrossRef] [Google Scholar]
- Pineda, J. S., Hallinan, G., & Kao, M. M. 2017, ApJ, 846, 75 [Google Scholar]
- Popinchalk, M., Faherty, J. K., Kiman, R., et al. 2021, ApJ, 916, 77 [NASA ADS] [CrossRef] [Google Scholar]
- Reiners, A., & Christensen, U. R. 2010, A&A, 522, A13 [NASA ADS] [CrossRef] [EDP Sciences] [Google Scholar]
- Reiners, A., Basri, G., & Christensen, U. R. 2009, ApJ, 697, 373 [NASA ADS] [CrossRef] [Google Scholar]
- Route, M., & Wolszczan, A. 2012, ApJ, 747, L22 [NASA ADS] [CrossRef] [Google Scholar]
- Route, M., & Wolszczan, A. 2016a, ApJ, 821, L21 [NASA ADS] [CrossRef] [Google Scholar]
- Route, M., & Wolszczan, A. 2016b, ApJ, 830, 85 [NASA ADS] [CrossRef] [Google Scholar]
- Saumon, D., & Marley, M. S. 2008, ApJ, 689, 1327 [Google Scholar]
- Saur, J., Willmes, C., Fischer, C., et al. 2021, A&A, 655, A75 [NASA ADS] [CrossRef] [EDP Sciences] [Google Scholar]
- Service, M., Lu, J. R., Campbell, R., et al. 2016, PASP, 128, 095004 [NASA ADS] [CrossRef] [Google Scholar]
- Shimwell, T. W., Hardcastle, M. J., Tasse, C., et al. 2022, A&A, 659, A1 [NASA ADS] [CrossRef] [EDP Sciences] [Google Scholar]
- Tokunaga, A. T., Simons, D. A., & Vacca, W. D. 2002, PASP, 114, 180 [CrossRef] [Google Scholar]
- Turnpenney, S., Nichols, J. D., Wynn, G. A., & Casewell, S. L. 2017, MNRAS, 470, 4274 [Google Scholar]
- van Dam, M. A., Bouchez, A. H., Le Mignant, D., et al. 2006, PASP, 118, 310 [NASA ADS] [CrossRef] [Google Scholar]
- van Haarlem, M. P., Wise, M. W., Gunst, A. W., et al. 2013, A&A, 556, A2 [NASA ADS] [CrossRef] [EDP Sciences] [Google Scholar]
- van Weeren, R. J., Shimwell, T. W., Botteon, A., et al. 2021, A&A, 651, A115 [NASA ADS] [CrossRef] [EDP Sciences] [Google Scholar]
- VanderPlas, J. T. 2018, ApJS, 236, 16 [Google Scholar]
- Vedantham, H. K., Callingham, J. R., Shimwell, T. W., et al. 2020, ApJ, 903, L33 [Google Scholar]
- Williams, P. K. G. 2018, in Handbook of Exoplanets, eds. H. J. Deeg, & J. A. Belmonte, 171 [Google Scholar]
- Williams, P. K. G., Gizis, J. E., & Berger, E. 2017, ApJ, 834, 117 [NASA ADS] [CrossRef] [Google Scholar]
- Wizinowich, P. L., Le Mignant, D., Bouchez, A. H., et al. 2006, PASP, 118, 297 [Google Scholar]
- Wright, E. L., Eisenhardt, P. R. M., Mainzer, A. K., et al. 2010, AJ, 140, 1868 [Google Scholar]
- Yelda, S., Lu, J. R., Ghez, A. M., et al. 2010, ApJ, 725, 331 [NASA ADS] [CrossRef] [Google Scholar]
- Zarka, P. 1998, J. Geophys. Res., 103, 20159 [Google Scholar]
- Zarka, P. 2007, Planet. Space Sci., 55, 598 [Google Scholar]
- Zarka, P., Cecconi, B., & Kurth, W. S. 2004, J. Geophys. Res.: Space Phys., 109, A09S15 [NASA ADS] [CrossRef] [Google Scholar]
All Tables
All Figures
|
Fig. 1. Discovery of radio emission from WISEP J101905.63+652954.2. Panel a: Stokes-V radio light curve of WISEP J101905.63+652954.2 with a bin width of 4 min (black points with ±1σ errorbars) and 16 min (red curve with shaded ±1σ uncertainty). The point marked with the black square is a significant detection with a flux density of −4.1 (7) mJy whose Stokes-V image is shown in panel c. Panels b and d: similar 4 min exposure images bracketing the integration shown in panel c. |
| In the text | |
|
Fig. 2. Lomb-Scargle periodogram of the radio light curve from Fig. 1. The dominant peak with a false alarm rate of under 3% is at 0.324 ± 0.033 h−1. |
| In the text | |
|
Fig. 3. Contour plots of one typical individual exposure for each filter in which we obtained infrared data. Contours are drawn in logarithmic intervals from the peak flux down to 10% of the peak flux in each image. The images are all 1 |
| In the text | |
Current usage metrics show cumulative count of Article Views (full-text article views including HTML views, PDF and ePub downloads, according to the available data) and Abstracts Views on Vision4Press platform.
Data correspond to usage on the plateform after 2015. The current usage metrics is available 48-96 hours after online publication and is updated daily on week days.
Initial download of the metrics may take a while.