Fig. 3.
Download original image
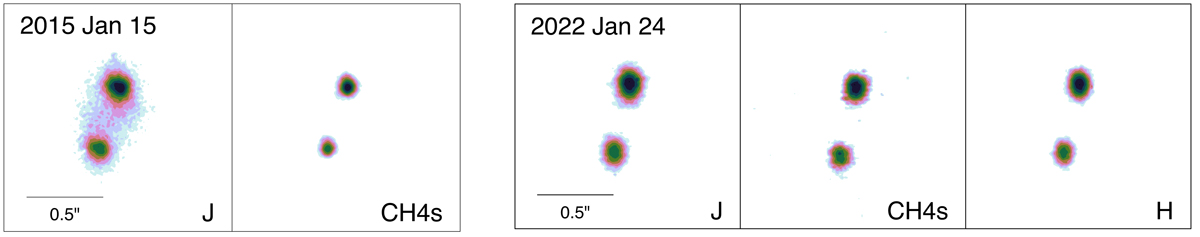
Contour plots of one typical individual exposure for each filter in which we obtained infrared data. Contours are drawn in logarithmic intervals from the peak flux down to 10% of the peak flux in each image. The images are all 1![]() 5 across with north being up. In 2015, despite the AO correction deteriorating from 0
5 across with north being up. In 2015, despite the AO correction deteriorating from 0![]() 09 in the CH4s band to 0
09 in the CH4s band to 0![]() 13 in the J band, the binary was still well resolved. We used the more precise differential magnitudes from the higher-quality, and fully contemporaneous 2022 images in our analysis.
13 in the J band, the binary was still well resolved. We used the more precise differential magnitudes from the higher-quality, and fully contemporaneous 2022 images in our analysis.
Current usage metrics show cumulative count of Article Views (full-text article views including HTML views, PDF and ePub downloads, according to the available data) and Abstracts Views on Vision4Press platform.
Data correspond to usage on the plateform after 2015. The current usage metrics is available 48-96 hours after online publication and is updated daily on week days.
Initial download of the metrics may take a while.