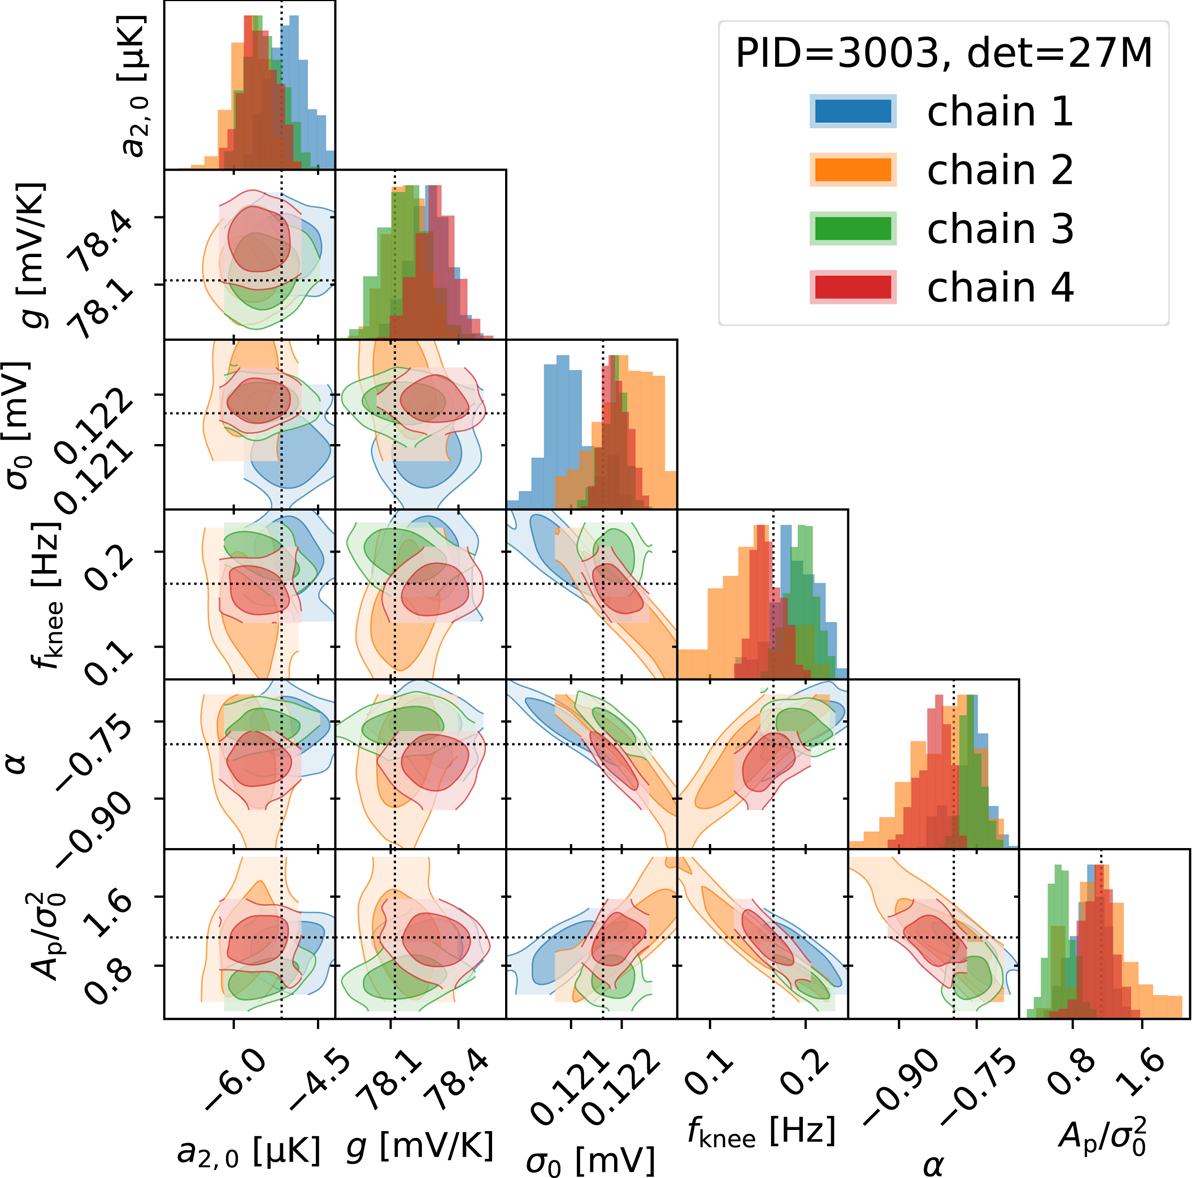
Fig. 5.
Download original image
Comparison of partial posteriors distributions from multiple short chains for the quadrupole amplitude, a2, 0, the gain, g, white noise level, σ0, knee frequency, fknee, correlated noise spectral index α, and log-normal noise amplitude, Ap. Each chain consists of 1000 samples. The posterior contours only span the range of the underlying samples, thereby making some of them appear open.
Current usage metrics show cumulative count of Article Views (full-text article views including HTML views, PDF and ePub downloads, according to the available data) and Abstracts Views on Vision4Press platform.
Data correspond to usage on the plateform after 2015. The current usage metrics is available 48-96 hours after online publication and is updated daily on week days.
Initial download of the metrics may take a while.