Fig. 4.
Download original image
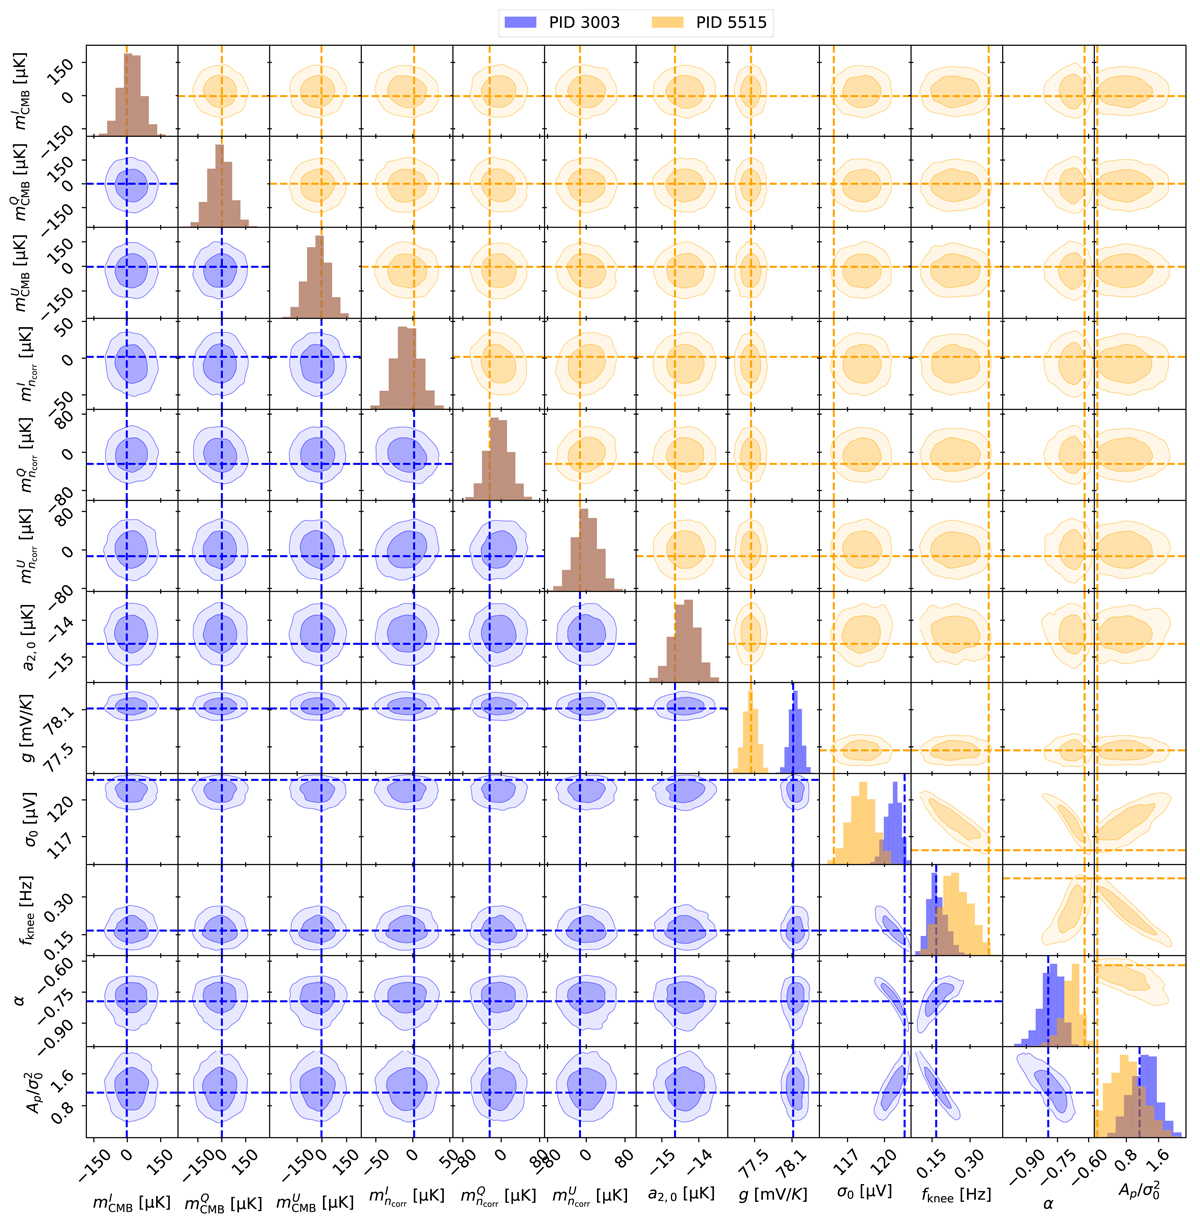
Recovered posterior distributions for a selected set of parameters from two PIDs and detectors. The contours indicate 68 and 95% confidence regions, while the dashed lines (in the respective color of the contours) show the true input value of each of the PIDs. The contours below (blue) and above (orange) the diagonal correspond to PIDs 3003 and 5515, respectively. From left to right along the horizontal axis, columns show (1)–(3) one arbitrary CMB map pixel in Stokes I, Q, and U; (4)–(6) correlated noise for the same pixel and Stokes parameters; (7) the CMB intensity quadrupole amplitude a2, 0; (8) gain g; and (9)–(12) the four correlated noise parameters, ξn = {σ0, fknee, α, Ap}. Note: the 1D histograms of the first seven parameters are completely overlapping since these parameters are independent of PID.
Current usage metrics show cumulative count of Article Views (full-text article views including HTML views, PDF and ePub downloads, according to the available data) and Abstracts Views on Vision4Press platform.
Data correspond to usage on the plateform after 2015. The current usage metrics is available 48-96 hours after online publication and is updated daily on week days.
Initial download of the metrics may take a while.